Figures & data
Figure 1. Logarithm of total value of trade for the 633 municipalities.
Note: Graduated map with averages for the period 2003–07.
Source: Authors’ own elaboration from the Spanish Road Freight Transportation Survey (RFTS) data.
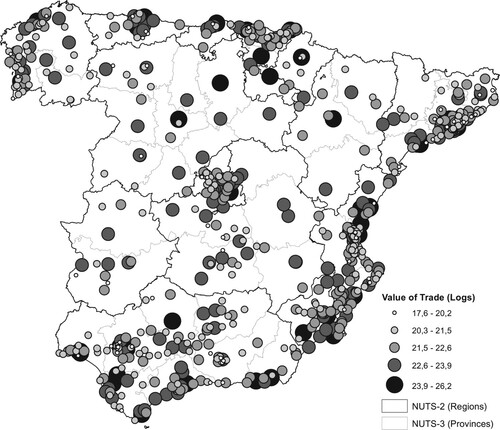
Table 1. Transport costs changes: averages for pairs of municipalities.
Table 2. Ordinary least squares (OLS) regressions in growth rates.
Figure 2. Kernel regressions of trade variables on generalized transport costs (GTCs) for pair of municipalities.
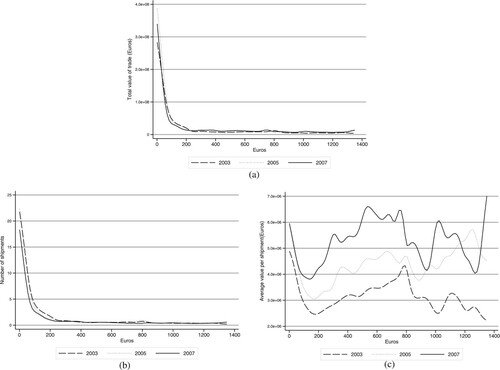
Table 3. Poisson pseudo-maximum likelihood (PPML) estimations with generalized transport cost (GTC) and internal borders.
Table 4. Cross-section regressions for 2003 and 2007.
Table 5. Generalized transport cost (GTC) breakpoints for the total value of trade and extensive margin: averages for the period 2003–07.
Figure 3. Natural trade areas using generalized transport cost (GTC) breakpoints.
Note: Averages for the period 2003–07.
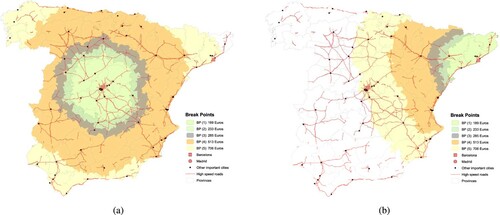
Table 6. Pseudo-maximum likelihood (PPML) estimations by generalized transport cost (GTC) thresholds: total value of trade, averages for the period 2003–07.
Table 7. Pseudo-maximum likelihood (PPML) estimations by generalized transport cost (GTC) thresholds: extensive margin, averages for the period 2003–07.
Figure 4. Kernel regressions between total value of trade and generalized transport costs (GTCs) for the municipalities of Madrid and Barcelona.
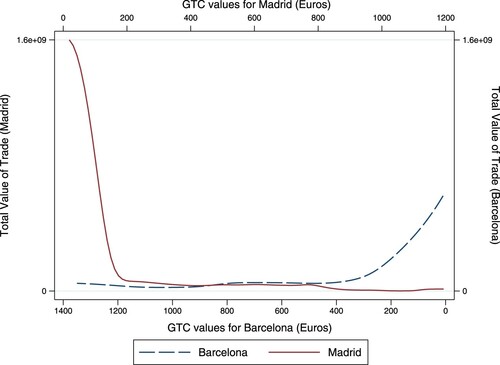
Table 8. Distribution of municipalities by different products and trading partners: . Percentage of municipalities in each interval, 2003 and 2007.
Table 9. Municipalities grouped by clusters: averages for the period 2003–07.
Figure 5. Kernel regressions between total trade and generalized transport costs (GTCs) for each pair of municipalities grouping them by clusters.
Note: Averages for the period 2003–07.
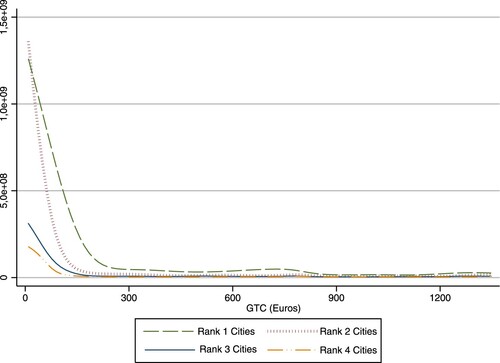
Table 10. Generalized transport cost (GTC) breakpoints by city rank: averages for the period 2003–07.
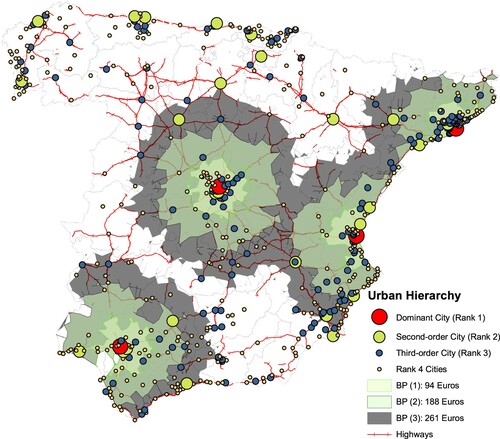
Figure 6. Urban hierarchy and natural trade areas for rank 1 municipalities.
Note: Plotted are the first, second and third generalized transport cost (GTC) breakpoints. The fourth breakpoint is equal to e665.