
Figures & data
Figure 1. A typology of the activities of financial centres involved in fossil fuel industry financing based on the nationalities of providers and clients.
Source: Adapted from Wójcik et al. (Citation2019).
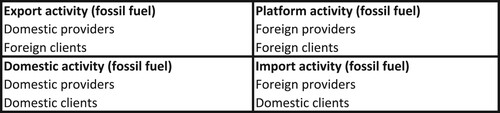
Table 1. Control variables definition and data sources.
Table 2. Top 20 financial centres involved in financing the fossil fuel industry, 2000–18 (based on total deal value).
Figure 2. Top 20 financial centres by fossil fuel investment brokerage type, 2000–18.
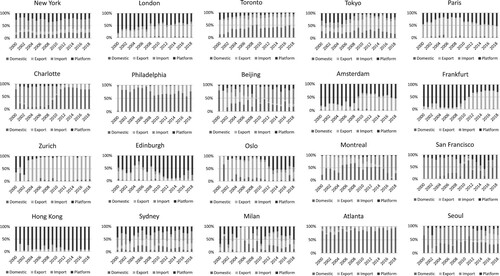
Figure 3. Top 20 financial centres financing fossil fuels by asset class, 2000–18.
Note: FF, fossil fuel; ECM, equity capital markets; and DCM, debt capital markets or bonds.
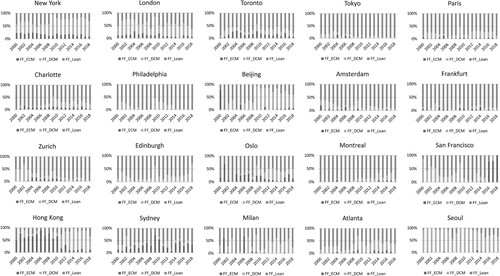
Figure 4. Global fossil fuel investment brokerage, 2000–18.
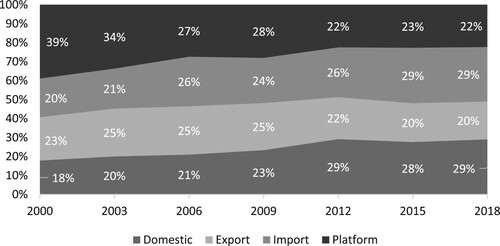
Figure 5. Global financing of fossil fuels at the financial centre level by asset class, 2000–18.
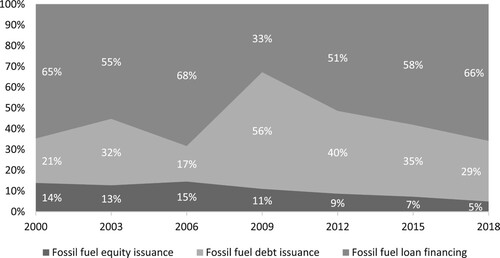
Table 3. Divestment commitments and green finance policy drivers (mandatory and voluntary) of city fossil fuel investment brokerage activity types, 2001–18.
Table 4. Divestment commitments and green finance policy drivers (mandatory and voluntary) of city fossil fuel investment brokerage activity types, 2001–18.
Table 5. Divestment commitments and green finance policy drivers (mandatory and voluntary) of city fossil fuel investment brokerage activity by asset class, 2001–18.