Figures & data
Table 1. Basic statistical parameters of nine labour market efficiency (LME) indicators.
Table 2. Principal component analysis (PCA) of nine labour market efficiency (LME) indicators.
Figure 1. Principal components plot of nine labour market efficiency (LME) indicators.
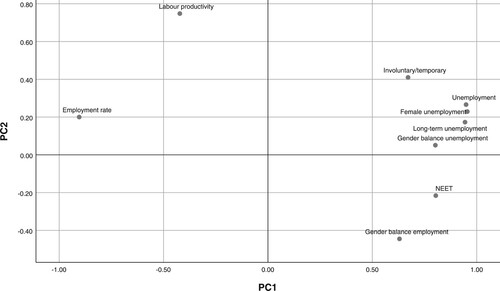
Figure 2. Dependence of the regional competitiveness index (RCI) 2019 on the resilience principal component (RPC), including the linear regression line and prediction intervals.
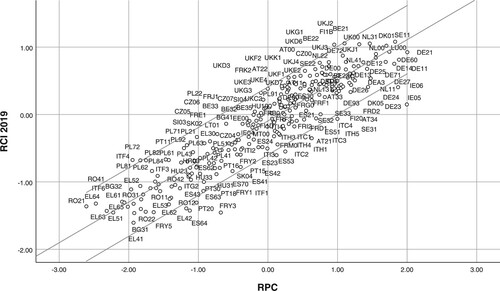
Figure 3. Dependence of the regional competitiveness index (RCI) 2019 on the vulnerability principal component (VPC), including the linear regression line and prediction intervals.
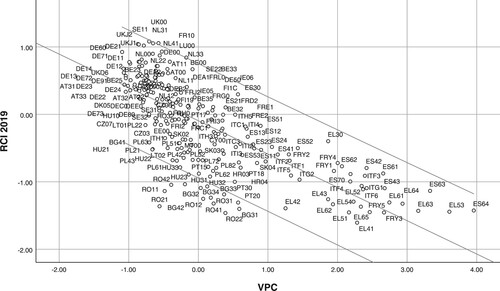
Table 3. Equality of slopes test in the linear regression model between the regional competitiveness index (RCI) 2019 and resilience principal component (RPC) for the first fixed categorical factor – development phase of regions.
Table 4. Equality of slopes test in the linear regression model between the regional competitiveness index (RCI) 2019 and vulnerability principal component (VPC) by development phase of regions.
Table 5. Parameters of linear regression model between the regional competitiveness index (RCI) 2019 and the vulnerability principal component (VPC) by development phase of regions.
Figure 4. Dependence of the regional competitiveness index (RCI) 2019 versus the vulnerability principal component (VPC) with the linear regression line in both development phase groups of regions.
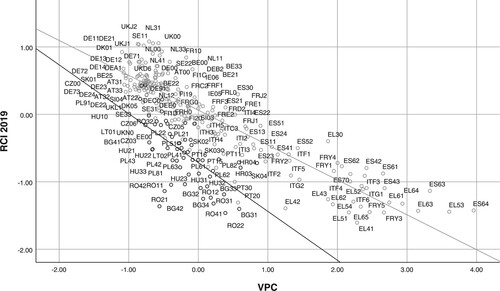
Figure 5. Classification and regression tree (CART) decision tree of regions with positive (black) versus negative (grey) values of the regional competitiveness index (RCI) 2019, using the resilience principal component (RPC), vulnerability principal component (VPC) and both fixed categorical factors.
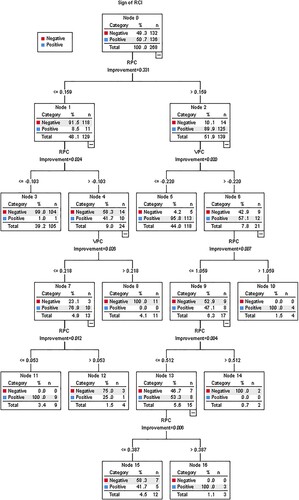
Table 6. Relative importance of variables in the classification and regression tree (CART) decision tree of the regional competitiveness index (RCI) 2019 value.
Table 7. Classification matrix of the classification and regression tree (CART) decision tree of the regional competitiveness index (RCI) 2019 sign by the resilience principal component (RPC) and vulnerability principal component (VPC).
Figure 6. Scatterplot of the vulnerability principal component (VPC) against the resilience principal component (RPC) with some partition values of the classification and regression tree (CART) decision tree.
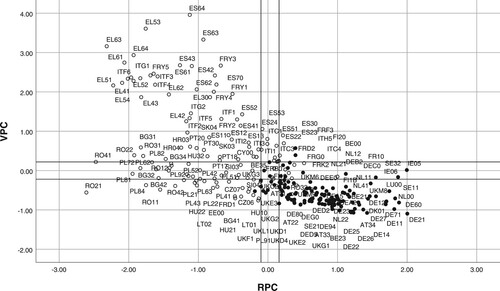
Figure 7. Classification and regression tree (CART) decision tree of regions with positive (black) values of the regional competitiveness index (RCI) 2019 versus negative (grey) values of the RCI 2019, using labour market efficiency (LME) indicators and two fixed categorical factors.
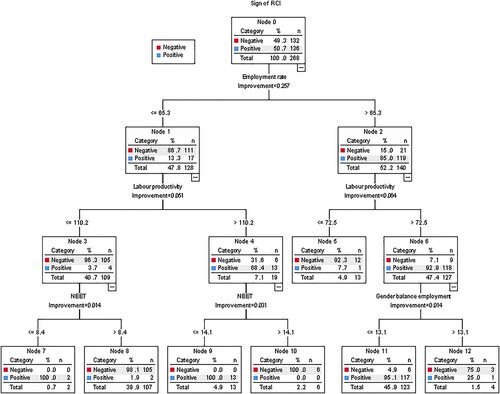
Table 8. Classification matrix of the classification and regression tree (CART) decision tree of the regional competitiveness index (RCI) 2019 performance by labour market efficiency (LME) indicators.
Figure 8. Scatterplot of labour productivity versus employment rate with partition values of the classification and regression tree (CART) decision tree.
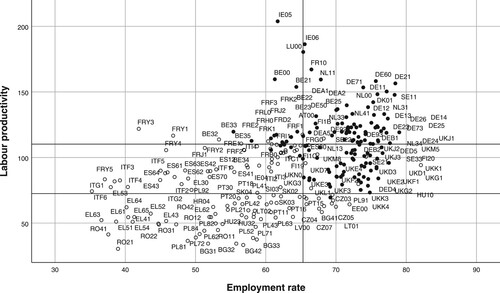
Table 9. Importance of variables in the classification and regression tree (CART) decision tree of regional competitiveness index (RCI) sign by labour market efficiency (LME) indictors.
Figure 9. Scatterplot of the resilience principal component (RPC) and vulnerability principal component (VPC).
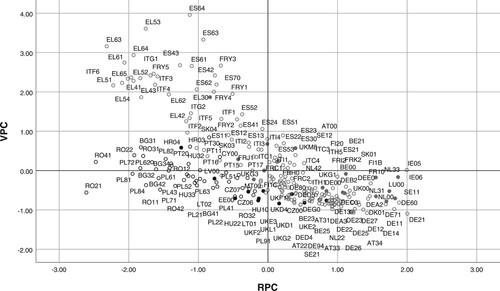
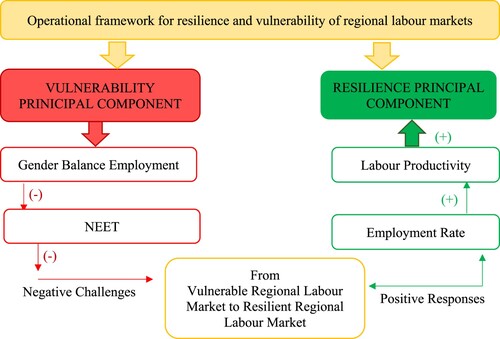
Figure 10. Spatial distribution of the proposed operational framework for resilience and vulnerability of regional labour markets in the EU.
Notes: RPC, resilience principal component; and VPC, vulnerability principal component. Quadrant 1: RPC+, VPC+; quadrant 2: VPC+, RPC–; quadrant 3: VPC–, RPC–; and quadrant 4: VPC–, RPC+. Readers of the print article can view the figures in colour online at https://doi.org/10.1080/00343404.2022.2042507
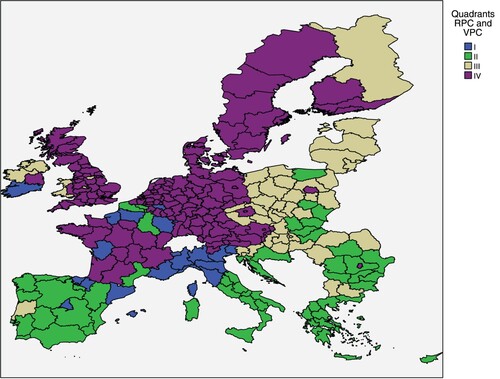
Figure 11. Operational framework for improving the resilience and reducing the vulnerability of regional labour markets.