Figures & data
Figure 1. Russia oil and gas regions.
Source: Gordon and Sautin (Citation2013). Permission to use granted by the Carnegie Endowment for International Peace.
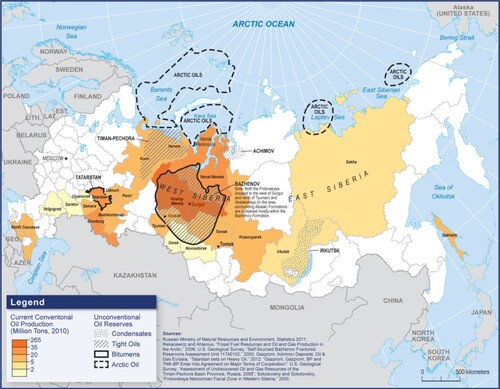
Figure 2. A firm’s triple bottom line (TBL) strategy shaped by regional, national and international policies.
Source: Authors based on a review of the literature.
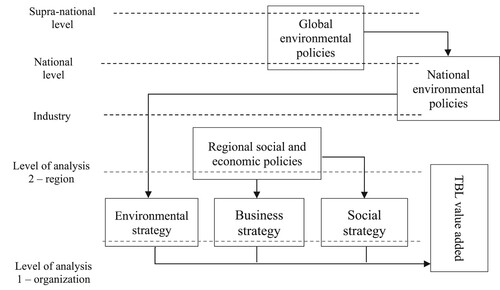
Figure 3. Levels of associated petroleum gas (APG) flaring (billions of m3) in Russia, 2012–19.
Sources: Authors based on data from the World Bank (https://www.ggfrdata.org/) and the Russian Federal State Statistics Service (https://rosstat.gov.ru/).
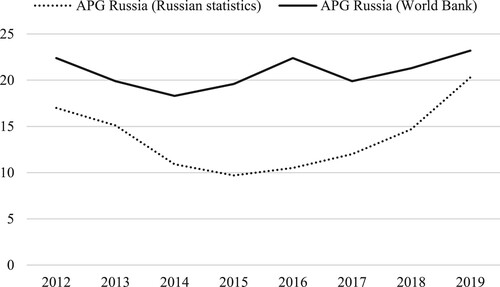
Figure 4. Emissions of pollutants from stationary sources into atmospheric air (thousands of tons per million tons of oil extracted) in the three Russian oil and gas exploration regions, 2012–19.
Source: Authors based on Russian Federal State Statistics Service data (https://rosstat.gov.ru/).
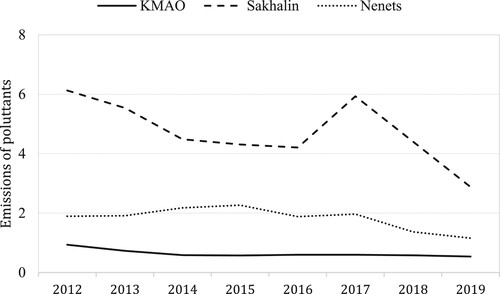
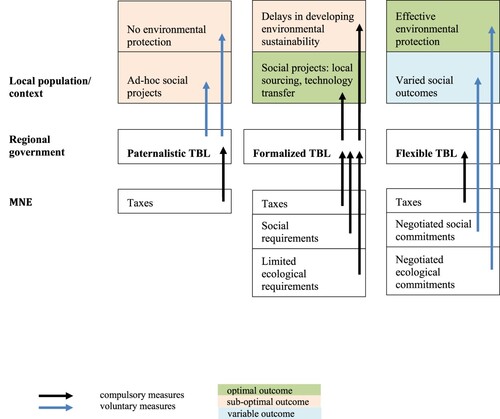
Figure 5. The triple bottom line (TBL) approaches.
Source: Authors.