
Figures & data
Table 1. Statements measuring regional resentment.a
Table 2. Descriptives for items measuring regional resentment.
Figure 1. Regional resentment over combinations of urbanity and distance to parliament.
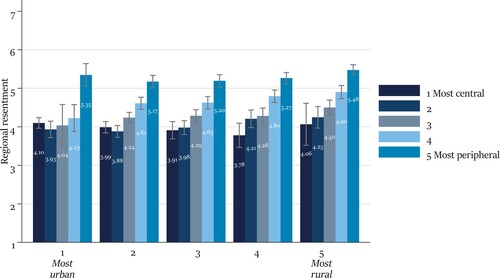
Figure 2. Multilevel regression predicting regional resentment.
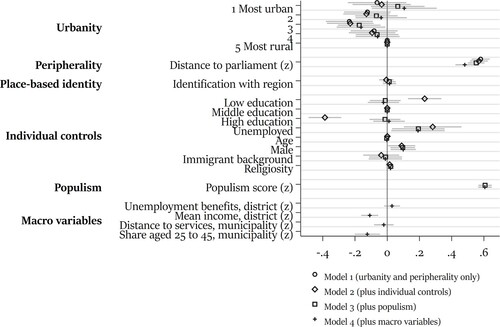
Figure 3. Predicted regional resentment based on distance to parliament and urbanity.
Note: With overlaid distribution of peripherality and urbanity.
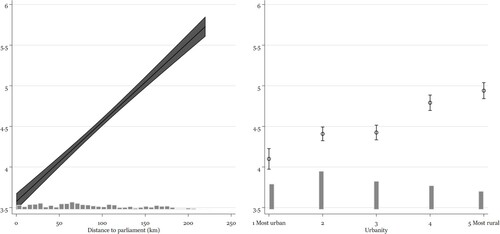
Figure 4. Marginal effects of regional identification and of deprivation indicators, by urbanity category.
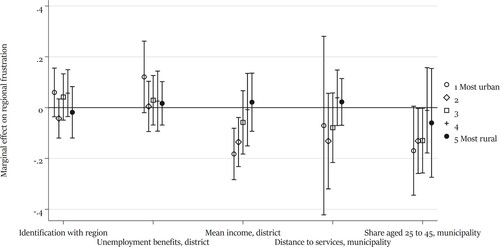
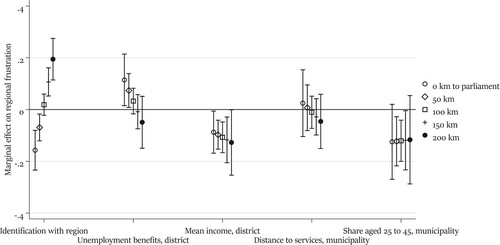
Figure 5. Marginal effects of regional identification and of deprivation indicators, by distance to parliament.
Supplemental Material
Download PDF (431.1 KB)DATA AVAILABILITY
The data and replication syntax for this study is available at https://osf.io/j3sr9/?view_only=d26bbfab71374e148474d5e4db2e0d76.