
Figures & data
Table 1. Dimensions, indicators, cut-offs and weights of the quality of employment (QoE) index.
Table 2. Quality of employment (QoE) index estimates.
Figure 1. Changes over time of the quality of employment (QoE) deprivation index, 1996–2017.
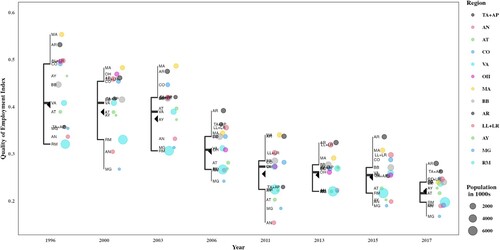
Figure 2. Regional growth elasticity and quality of employment (QoE) deprivation index.
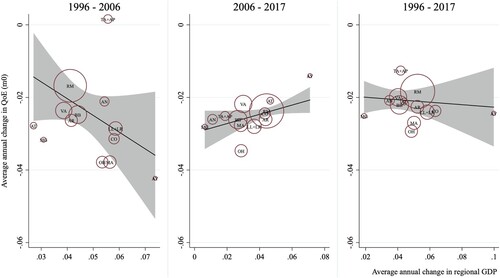
Table 3. Regional regressions and macro-indicators.
Figure 3. Percentage contribution to the quality of employment (QoE) index (M0) by region, 1996 and 2017.
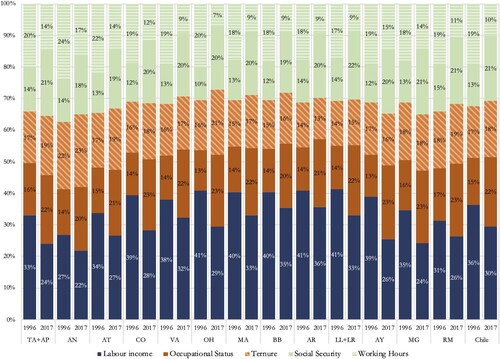
Figure 4. Cumulative probability of working hours and hourly wages, 1996 and 2017.
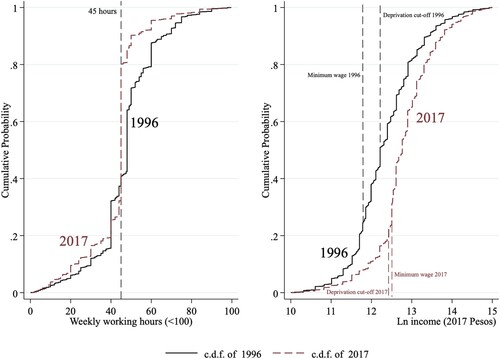
Table 4. Heckman probit regression results, 1996 and 2017.
Supplemental material