Figures & data
Figure 1. Net overseas migration (a) and net interstate migration (b) in five main states of Australia.
Source: Australian Bureau of Statistics (ABS) 34120 Migration, Australia.
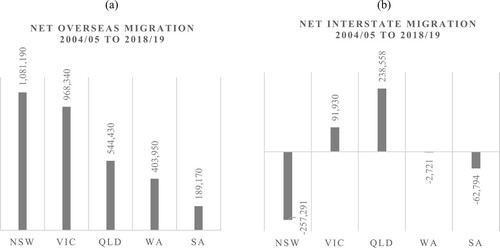
Figure 2. (a) Total migration inflows in New South Wales, Victoria and Queensland; and (b) total migration inflows in greater capital city statistical areas (GCCSA) and rest of state statistical areas (RSSA).
Source: Calculated by the authors.
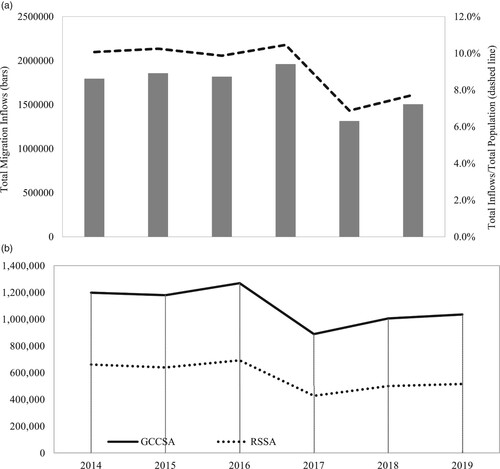
Table 1. Descriptive statistics.
Table 2. Internal migration inflows and house price changes with instrument.
Table 3. Relationship between origin SA3-level area shares and local area characteristics.
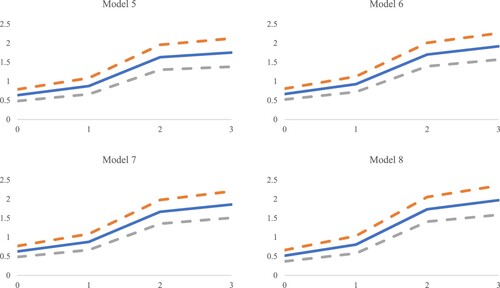
Figure 3. Instrumental variables local projections (IV-LP) (cumulative) response of median house prices for an exogenous shock to the internal migration.
Note: Dashed lines are the 2 SE confidence interval (CI) bands.