Figures & data
Figure 1. Top 10 domestic mergers and acquisitions (M&A) flows, 2007–17.
Note: Arrows lead from acquirers to targets.
Source: Authors’ calculations based on Dealogic data.
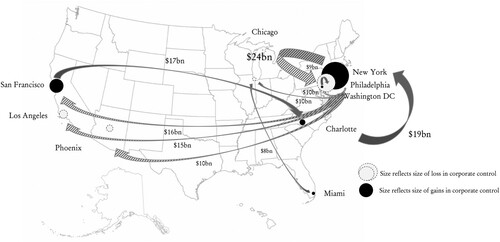
Figure 2. Finance, insurance and real estate (FIRE): specialization, 2017; and employment shifts, 2007–17.
Note: The highlighted quadrant includes cities with above average FIRE employment specialization, which have gained shares of national FIRE employment. The boundaries of the following metropolitan statistical areas (MSAs) have changed between 2007 and 2017: Dallas–Fort Worth–Arlington, TX; Virginia Beach–Norfolk–Newport News, VA–NC; Grand Rapids–Wyoming, MI; Washington–Arlington–Alexandria, DC–VA–MD–WV; Atlanta–Sandy Springs–Roswell, GA; Minneapolis–St. Paul–Bloomington, MN–WI; Charlotte–Concord–Gastonia, NC–SC; Columbus, OH; Indianapolis–Carmel–Anderson, IN; Nashville–Davidson–Murfreesboro–Franklin, TN; Memphis, TN–MS–AR; New Orleans–Metairie, LA; Rochester, NY; Houston–The Woodlands–Sugar Land, TX; Salt Lake City, UT; St. Louis, MO–IL; Cincinnati, OH–KY–IN; and Kansas City, MO–KS.
Source: Authors’ calculations based on Bureau of Labor Statistics (BLS) data.
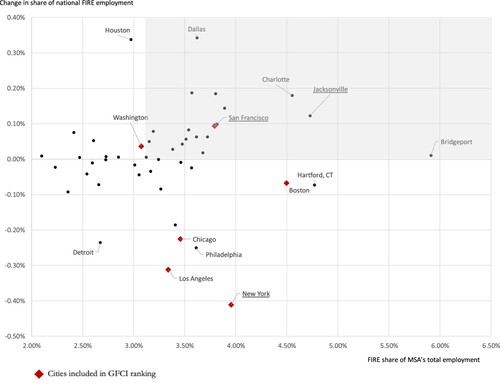
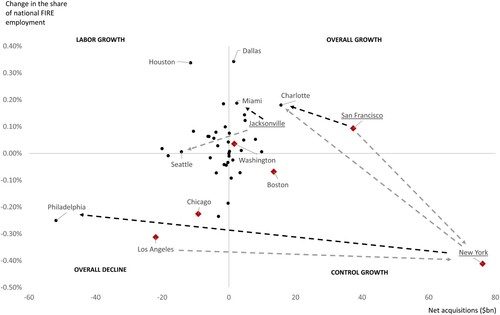
Figure 3. Finance, insurance and real estate (FIRE) labour and control shifts, 2007–17, a typology of financial centre evolution.
Source: Authors’ calculations based on Bureau of Labor Statistics (BLS) and Dealogic data.