
Figures & data
Figure 1. Differences in (a) cases per capita and (b) lockdown days among the 63 provinces of Vietnam.
Note: Lighter colours represent fewer infected cases and lockdown days; dark colours represent the opposite. The number of lockdown days was calculated from the difference between the implementation of Directive No. 16/CT-TTg and 29 July 2021 (i.e., last day of non-pharmaceutical intervention).
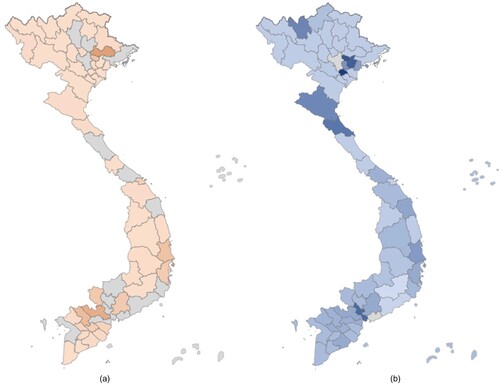
Figure 2. Effects of localized lockdown on the number of infected cases.
Note: Results from the panel event study are shown. Point estimates are represented along with their 95% confidence intervals as described in the model equation in specific time intervals and controlling for residential mobility and national holidays. The baseline (omitted) base period (solid vertical line) was one day before the adoption of a localized lockdown by each province. The event date was when each province applied Directive No. 16/CT-TTg (i.e., strict social distancing measures) to contain the spread of COVID-19.
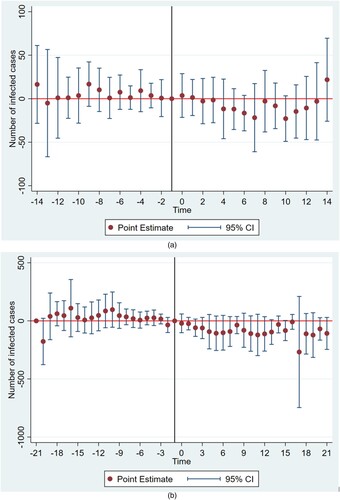
Figure 3. Effects of localized lockdown on the number of infected cases considering fixed effects.
Note: Results from the panel event study are shown considering multiple levels of fixed effects. Point estimates are represented along with their 95% confidence intervals as described in the model equation in specific time intervals and controlling for residential mobility (estimated by principal component analysis) and national holidays.
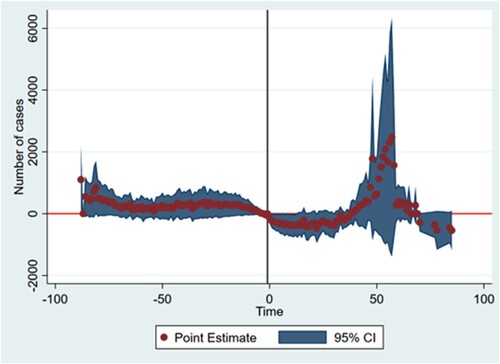
Figure 4. Effects of localized lockdown on the cases per population considering fixed effects.
Note: Results from the panel event study are shown considering multiple levels of fixed effects with cases per population. Point estimates are represented along with their 95% confidence intervals as described in the model equation in specific time intervals and controlling for residential mobility (estimated by principal component analysis – PCA) and national holidays.
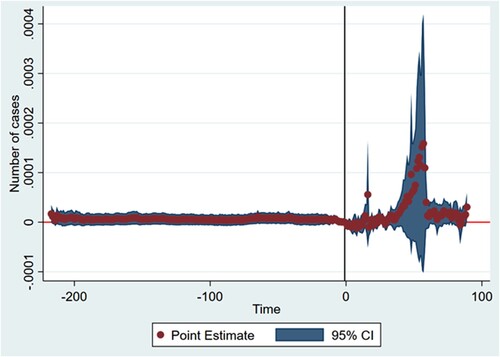
Table 1. Post-estimation test for the joint significance of leads, lags and event terms.
Table 2. Estimation results of mobility and socio-economic factors on the number of infected cases.
Supplemental Material
Download PDF (786.5 KB)DATA AVAILABILITY
The data are available from the author upon request.