
Figures & data
Figure 1. Causal path diagram for excess mortality in terms of ethnic minorities, income inequality and other variables.
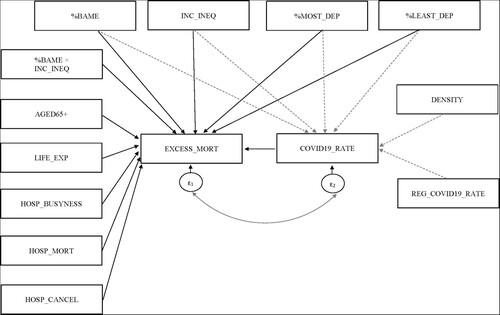
Table 1. Descriptive statistics for the 310 local councils analysed and for subgroups of high- and low-income unequal council.
Figure 2. Excess mortality and percentage of BAME in English local councils.
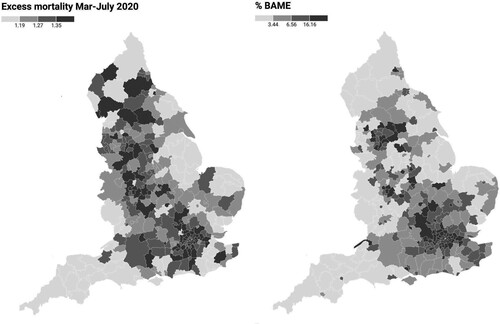
Table 2. Pearson’s correlation coefficients.
Table 3. Main results.
Table 4. Additional analysis. Income deprivation and the relationship between COVID-19 excess mortality and ethnic minorities.
Table 5. Additional analysis: job inequality and the relationship between COVID-19 excess mortality and ethnic minorities.
Table 6. Additional analysis: ethnic minorities are estimated as the proportion of the population that has White British ethnicity.