
Figures & data
Figure 1. Standard deviation of the relative asymmetry index in the period 1980–2015 in different spatial scales.
Source: Authors’ own elaboration based on the European Regional Database Citation2017 (European Commission – Joint Research Centre & Cambridge Econometrics, Citation2018).
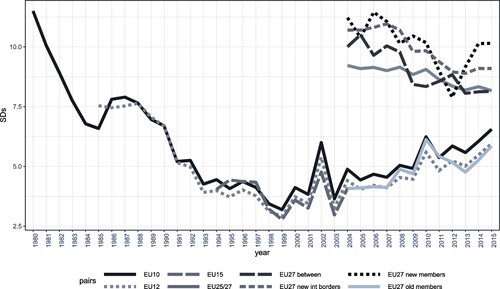
Table 1. Results of the analysis of σ-convergence of the relative asymmetry index by enlargements of the EU.
Table 2. Results of the analysis of absolute β-convergence of the relative asymmetry index by enlargements of the EU.
Figure 2. Asymmetry and cross-border convergence in the EU in 1980–85, 1985–94, 1994–2004 and 2004–15.
Source: Authors’ own elaboration based on European Regional Database Citation2017 (European Commission – Joint Research Centre & Cambridge Econometrics, Citation2018).
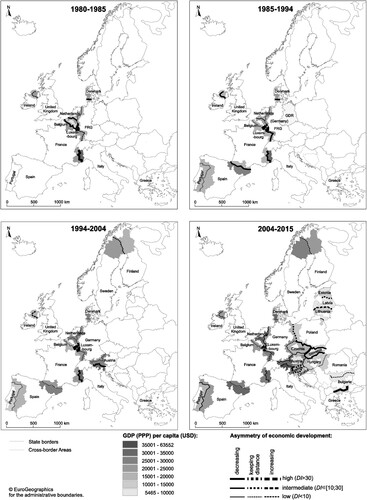
Table 3. Results of the estimation of the model explaining the rate of changes in the relative asymmetry index in border regions by means of rate of changes in the analogical index at the national level.