Figures & data
Table 1. Decomposition of growth in gross domestic product (GDP) per head, 2000–18.
Figure 1. Components of the Northern Ireland economic strategy in the context of the programme for government.
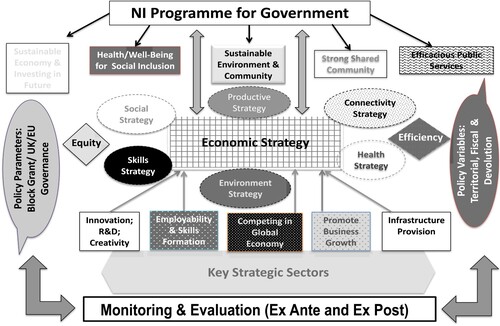
Figure 2. Strategic framework for economic growth.
Source: Northern Ireland Executive (Citation2012).
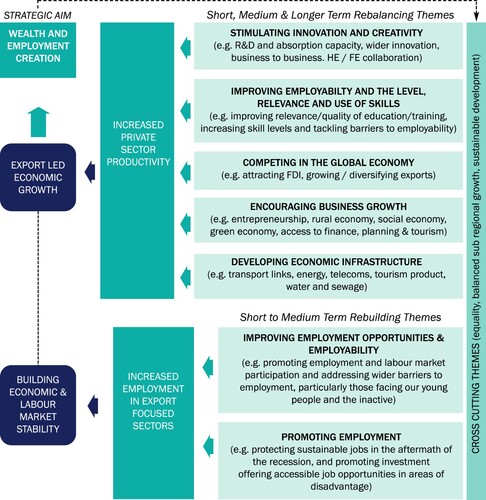
Table 2. MATRIX panel priorities.
Figure 3. Smart Specialisation priorities for Northern Ireland.
Source: Northern Ireland Executive (Citation2014).
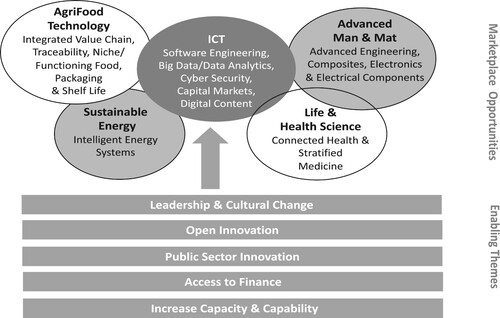
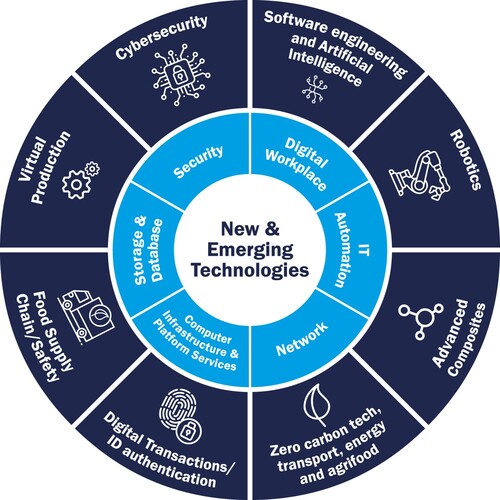
Figure 4. Enabling technologies for Northern Ireland.
Source: Department for the Economy (Citation2021).