Figures & data
Figure 1. Total European Union employment rate dynamics and demarcation of resilience stages: city-level data.
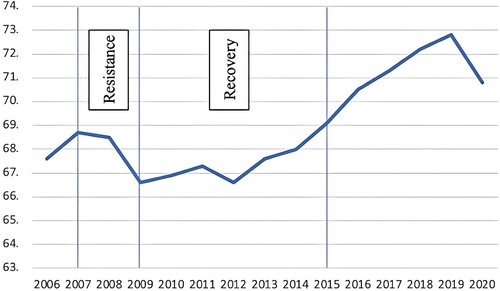
Figure 2. Urban labour market resilience index (ULMRI) for the resistance and recovery phases, and percentage change of the index in recovery versus resilience.
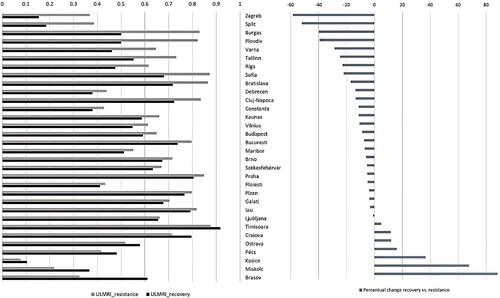
Figure 3. Index values for the six smart components and the urban labour market resilience index (UMLRI), in the resistance period, for each of the four nodes.
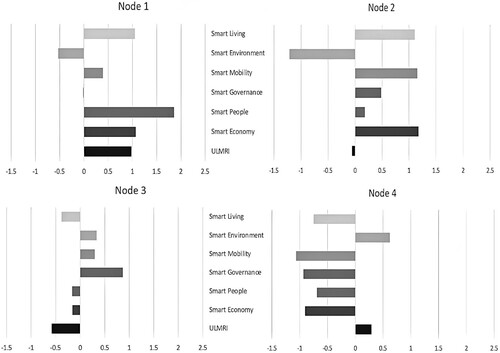
Table 1. Classification of the units into the four nodes, resistance period.
Figure 4. Index values for the six smart components and the urban labour market resilience index (UMLRI), in the recovery period, for each of the four nodes.
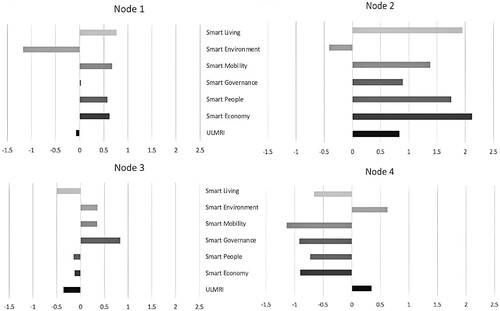
Table 2. Classification of the units into the four nodes, recovery period.
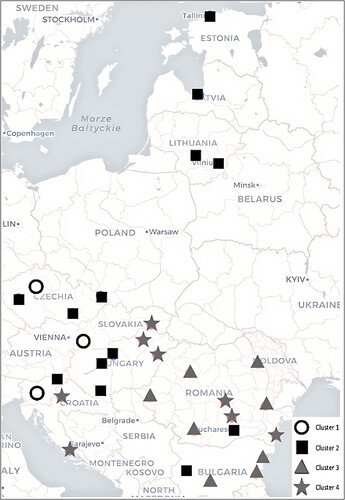
Figure 5. Spatial distribution of the metropolitan regions in the resistance stage according to their cluster membership.
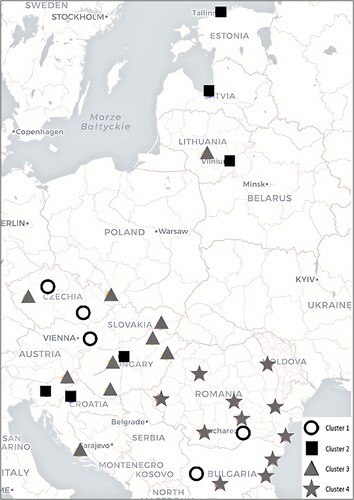
Figure 6. Spatial distribution of the metropolitan regions in the recovery stage according to their cluster membership.
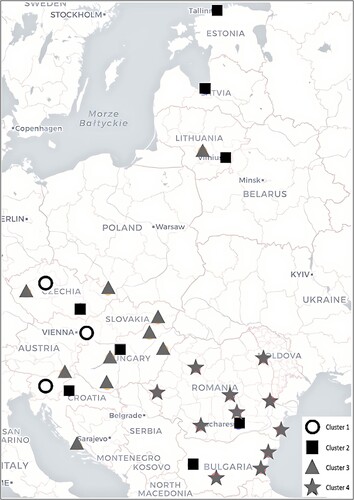
Figure 7. Resilience indexes for the urban labour market and the aggregated urban smartness of the metropolitan regions for the resistance timeframe.
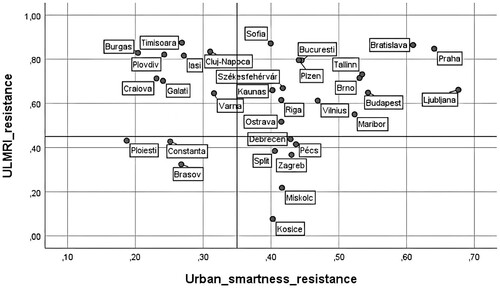
Figure 8. Resilience indexes for the urban labour market and the aggregated urban smartness of metropolitan regions for the recovery timeframe.
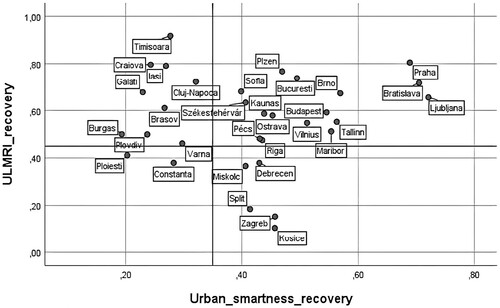
Figure 9. Index values for the six smart components and the urban labour market resilience index (UMLRI) in aggregate form, in the resistance period, for each of the four nodes.
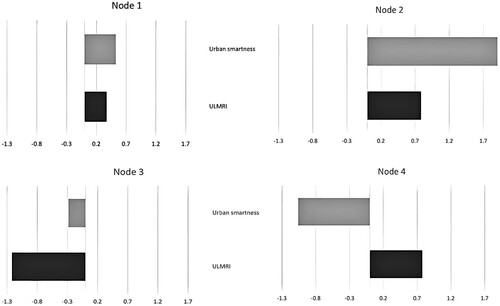
Figure 10. Index values for the six smart components and the urban labour market resilience index (UMLRI) in aggregate form, in the resistance period, for each of the four nodes.
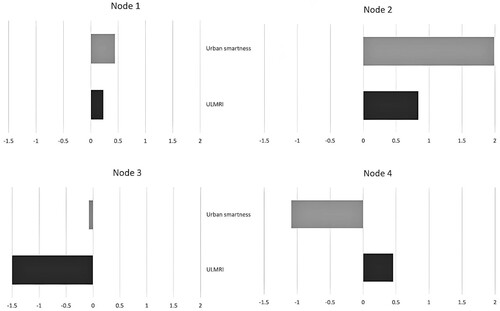
Figure 11. Spatial distribution of metropolitan regions in the resistance stage, according to their cluster membership, aggregated form.
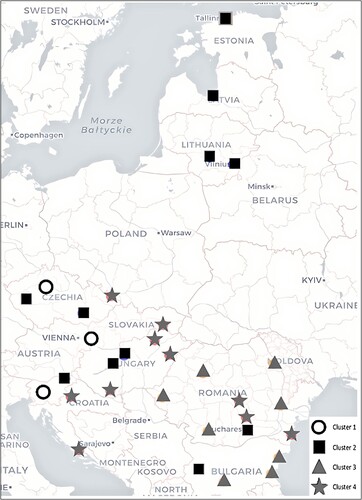
Figure 12. Spatial distribution of metropolitan regions in the recovery stage, according to their cluster membership, aggregated form.