
Figures & data
Figure 1. English local authority districts (LADs) by rural–urban classification.
Source: DEFRA, RUC11, LAD21. © Crown Copyright and database rights 2023 Ordnance Survey Licence No. 100022861.
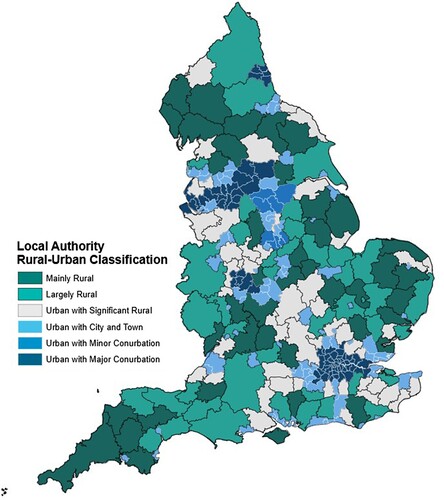
Table 1. Place of residence as a predictor of likelihood of poverty.
Table 2. Changes in government spending and welfare in urban versus rural areas (%) and distribution across population quartiles.
Figure 2. Share of working-age individuals in poverty by rural–urban residence in England, 2010 and 2018.
Source: Authors’ analysis of data from the Understanding Society Survey (USS).
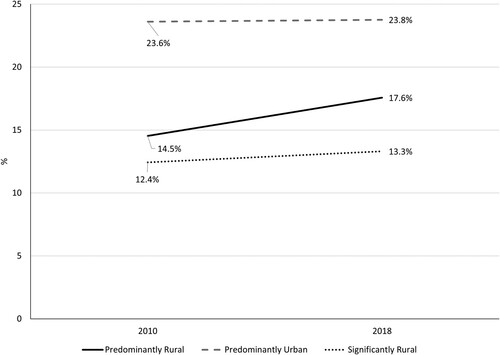
Table 3. Sociodemographic and economic characteristics by place of residence, England, 2018.
Figure 3. Real terms change in local government service spending by 2005 index of multiple deprivation and rural–urban residence: England, 2009–10 to 2016–17 (% change).
Source: Authors’ analysis of data from the Understanding Society Survey (USS) and Institute of Fiscal Studies (IFS) data.
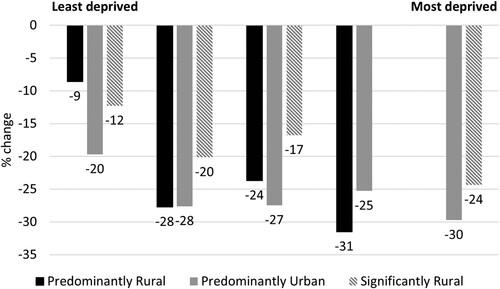
Figure 4. England: real-terms change in local government spending power by 2005 index of multiple deprivation and rural–urban residence: 2014/15–2018/19.
Source: Authors’ analysis of data from the Understanding Society Survey (USS) and Ministry of Housing, Communities & Local Government (MHCLG) data.
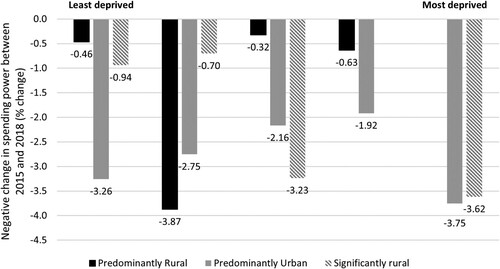
Figure 5. Decline in per capita income as a result of cuts to welfare benefits by 2005 by index of multiple deprivation and rural–urban residence.
Source: Authors’ analysis of data from the Understanding Society Survey (USS) and from Beatty and Fothergill (Citation2018).
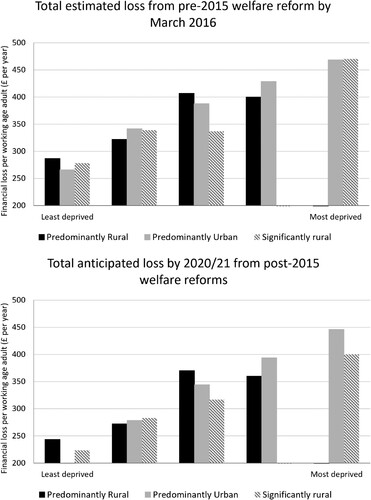
Table 4. Predictors of poverty.
DATA AVAILABILITY
The data analysed in this study are all publicly available: for the Understanding Society dataset, see https://www.understandingsociety.ac.uk/documentation; see https://www.gov.uk/government/publications/core-spending-power-final-local-government-finance-settlement-2019-to-2020 for local authorities’ core spending power, and see the Institute for Fiscal Studies (https://ifs.org.uk/publications/8781) for their service spending; for the data on the financial impact of welfare reforms, see https://www4.shu.ac.uk/research/cresr/ourexpertise/the-uneven-impact-of-welfare-reform; and for The Rural Urban Local Authority Classification data, see https://www.gov.uk/government/statistics/2011-rural-urban-classification-of-local-authority-and-other-higher-level-geographies-for-statistical-purposes/.