
Figures & data
Figure 1. Patent intensity by lower super output area (LSOA), 2017.
Notes: Patents per 10,000 working-age population in each LSOA. Readers of the print article can view the figures in colour online at https://doi.org/10.1080/00343404.2023.2252900
Sources: Patents data are from the Intellectual Property Office (IPO) (see the text for derivation); working population data are from the National On-line Manpower Information System (NOMIS).
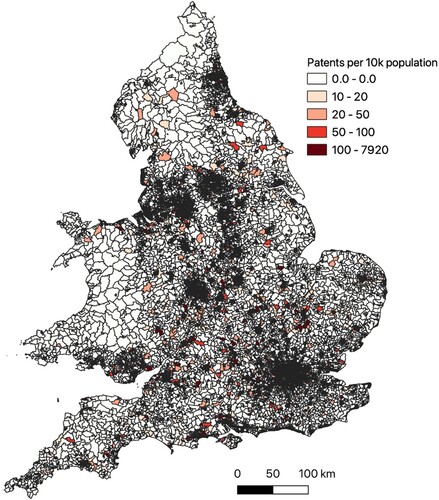
Figure 2. Trademark intensity by lower super output area (LSOA), 2017.
Note: Trademarks are per 10,000 working population in each LSOA.
Sources: Trademark data are from the Intellectual Property Office (IPO) (see the text for derivation); working population data are from the National On-line Manpower Information System (NOMIS).
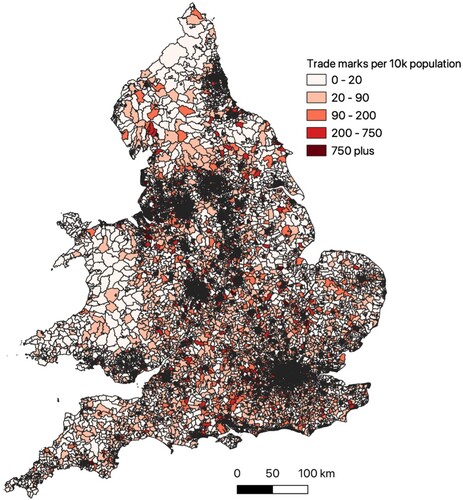
Figure 3. Registered design intensity by lower super output area (LSOA), 2017.
Note: Registered designs are per 10,000 working population in each LSOA.
Sources: Designs data are from the Intellectual Property Office (IPO) (see the text for derivation); working population data are from the National On-line Manpower Information System (NOMIS).
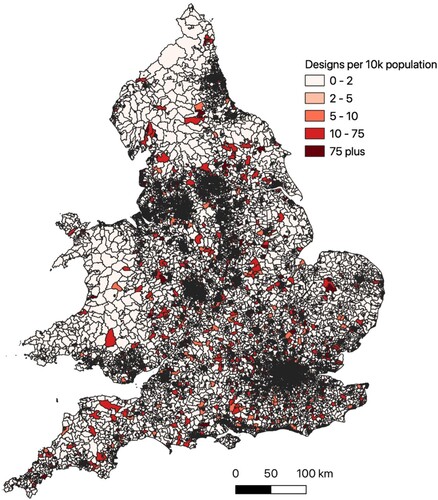
Figure 4. Population density (persons/km2) by lower super output area (LSOA), 2015.
Source: Office of National Statistics (ONS).
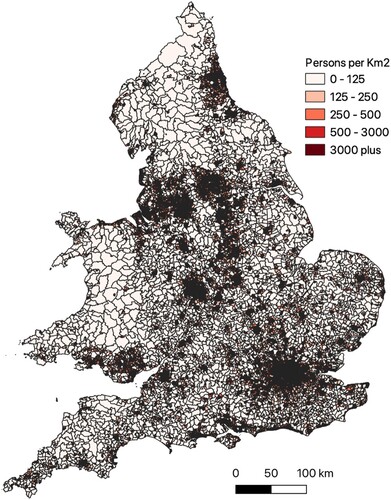
Figure 5. Multi-mode journey time to the nearest town centre, 2015.
Note: Values are the shortest journey time (min) by car or public transport to nearest town centre in 2015. No data are available for Wales or for areas where the journey time is greater than 120 min.
Source: Department of Transport.
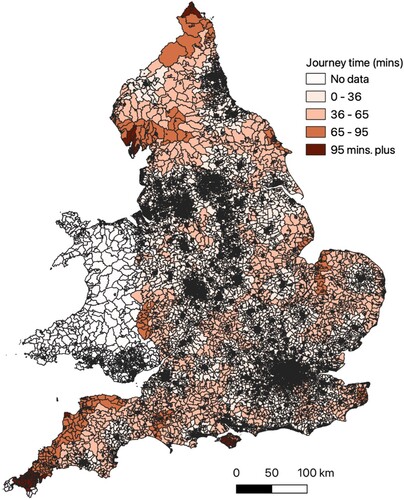
Table 1. Spatial autoregressive (SAR) models for patent intensity and related diagnostics.
Table 2. SAR models for trademark intensity and diagnostic material.
Table 3. SAR models for registered design intensity and diagnostic material.
Supplemental Material
Download PDF (588.5 KB)DATA AVAILABILITY
The statistical data used here are from the Office of National Statistics (ONS) and are Crown copyright and reproduced with the permission of the controller of HMSO and the Queen’s Printer for Scotland. The use of the ONS statistical data in this work does not imply the endorsement of the ONS in relation to the interpretation or analysis of the statistical data. The analysis upon which this paper is based uses research datasets that may not exactly reproduce National Statistics aggregates.