
Figures & data
Figure 1. European Quality of Government index (QoG), (a) 2010 and (b) 2017.
Note: Darker hues indicate higher quality of government. The legend is based on the quartile calculation for 2010.
Source: Authors’ on calculations based on the European Quality of Government index (QoG) from the QoG Institute, Gothenburg University.
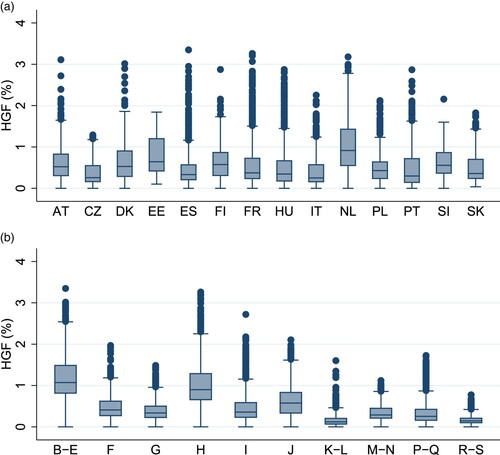
Figure 2. Share of high-growth firms and quality of regional government, 2017.
Sources: Authors’ on calculations based on the European Quality of Government index (QoG) from the QoG Institute, Gothenburg University; and Eurostat–SBS data.
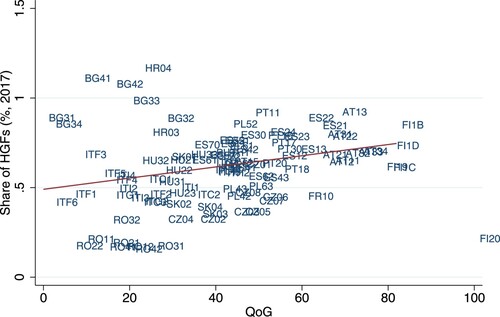
Figure 3. Share of high-growth firms by country and sector, average for 2008–18.
Note: The box plots display the first to the third quartiles. The vertical line is the median. Whiskers represent the minimum and maximum.
Countries are: AT = Austria; CZ = Czechia; DK = Denmark; EE = Estonia; ES = Spain; FI = Finland; FR = France; HU = Hungary; IT = Italy; NL = Netherlands; PL = Poland; PT = Portugal; SI = Slovenia; and SK = Slovakia.
Sectors are: B–E: Industry (B = Mining and quarrying; C = Manufacturing; D = Electricity, gas, steam and air-conditioning supply; E = Water supply; sewerage, waste management and remediation activities). F = Construction. G = Wholesale and retail trade; repair of motor vehicles and motorcycles. H = Transport and storage. I = Accommodation and food service activities. J = Information and communication. K–L: K = Financial and insurance activities; L = Real estate activities. M–N: M = Professional, scientific and technical activities; N = Administrative and support service activities. P–Q: P = Education; Q = Human health and social work activities. R–S: R = Arts, entertainment and recreation; and S = Other service activities.
Source: Authors’ calculations based on Eurostat–SBS data.
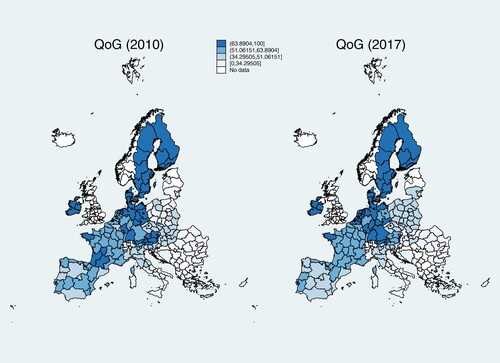
Table 1. Description of the variables.
Table 2. Summary statistics.
Table 3. Cross-correlation table.
Table 4. Averages of high-growth firms (HGFs) (%), product and labour market regulation, by regions group.
Table 5. Instrumental variables (IV) estimation (two-step generalized method of moments – GMM).
Table 6. Literacy rate as an instrumental variable (IV).
Table 7. Instrumental variables (IV) generalized method of moments (GMM) estimation, by level of the European Quality of Government index (QoG).
Figure 4. European Quality of Government index (QoG), by country, 2010 (vertical axis) and 2017 (horizontal axis).
Source: Authors’ calculations based on the European Quality of Government index (QoG) from the QoG Institute, Gothenburg University.
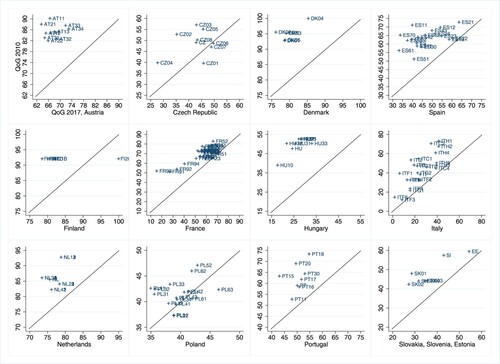
Table 8. Instrumental variables (IV) generalized method of moments (GMM) estimation, by European Quality of Government index (QoG) dynamics.
Table 9. Fixed effects estimation results.