Figures & data
Table 1. Ethnic quotas in Asia's national legislatures.
Figure 1. Legislative representation of ethnic/Indigenous groups per country (most recent election). Source: Compiled by author from within-country election results data (allcountries.org, Citation2020; Election Commission of India, Citation2018, Citation2019; FAFEN, Citation2018a; IFES, Citation2017; New Zealand Electoral Commission, Citation2020; Singapore Elections Department, Citation2020; Taiwan Central Election Commission, Citation2020; Vietnam Law and Legal Forum, Citation2016).
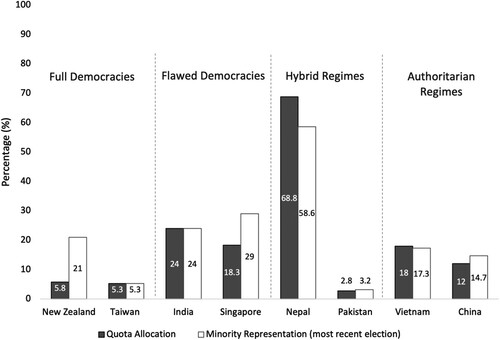
Figure 2. Taiwan: Percentage of legislative seats reserved for Indigenous representatives and won by Indigenous representation (1972–2020). Source: Extracted from (Templeman, Citation2018).
Note: The number of non-quota Indigenous MPs is not consistently recorded but has been included as estimates.
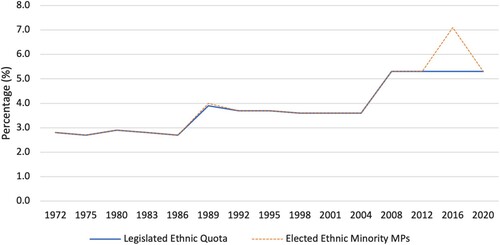
Table 2. Average Monthly Income (US$) for Taiwanese Indigenous Population 2019.
Table 3. Highest educational attainment of Taiwanese population over time.
Figure 3. Singapore: Percentage of legislative seats reserved for ethnic minority representatives and won by ethnic minority representatives (1968–2020). Source: Compiled based on data from (Singapore Elections Department, Citation2020).
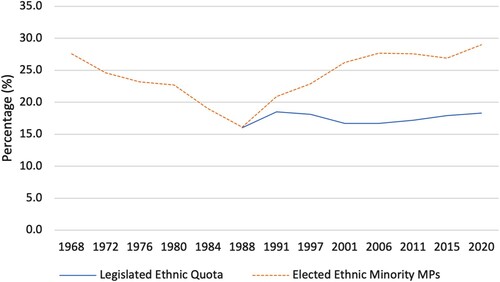
Table 4. Monthly household income from work by ethnicity (Singapore).
Table 5. Resident households by type of dwelling and ethnic group of head, 2000–2015.
Table 6. Resident population and highest qualifications attained, 2000–2015.
Figure 4. Pakistan: Percentage of legislative seats reserved for religious minorities and won by religious minorities (1977–2018). Source: Extracted from (FAFEN, Citation2018b).
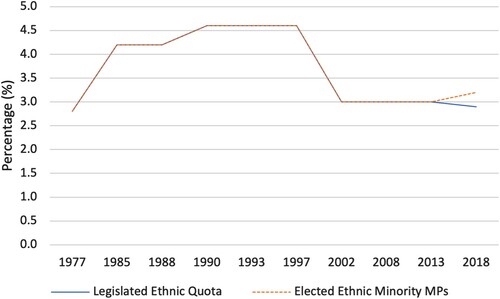
Table 7. Share of non-Muslim federal government employees in Pakistan.
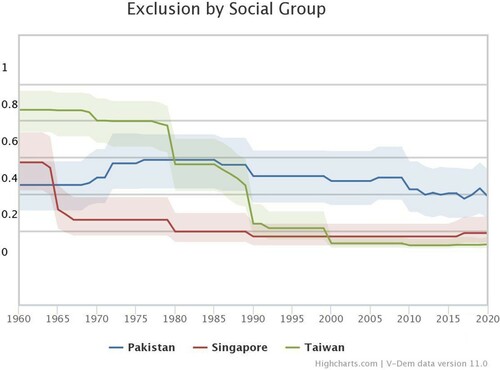
Figure 5. V-Dem Exclusion by Social Group Index: Taiwan, Singapore and Pakistan (1960–2020). Source: Created by author from V-Dem Exclusion by Social Group Index (Coppedge et al., Citation2021).