Figures & data
Table 1 Indicators of internal load in stratified (A) and polymictic lakes (B)
Figure 1 (A) P and DRP profiles at the dam of eutrophic Brownlee Reservoir, Snake River, CO, 11 August 1999; (B) P, dissolved oxygen (DO) and iron profiles (TFE = total; SFe = soluble; FE2 = ferrous) in oligotrophic Chub Lake, Ontario, Sep 13, 1982 (note lake characteristics in ).
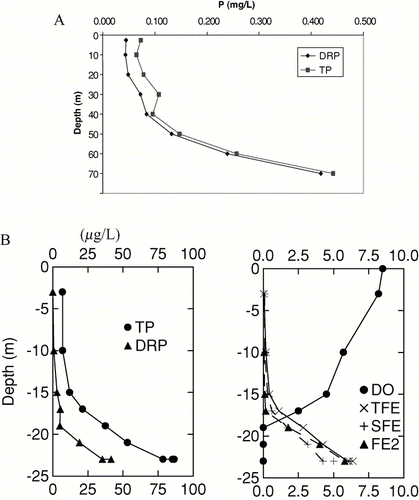
Figure 2 Comparison of DRP with TP from individual measurements in the anoxic hypolimnion of eight stratified Canadian lakes (with data from CitationNürnberg and Peters 1984b).
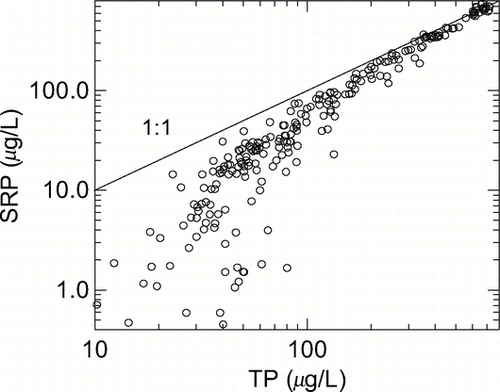
Table 2 Characteristics of lakes and reservoirs used as examples and case studies (Nürnberg, unpublished data; avg = average, max = maximum).
Figure 3 Lint_1 estimate from in situ TP increases in polymictic Lake Mitchell Reservoir, SD, for summer 2001.
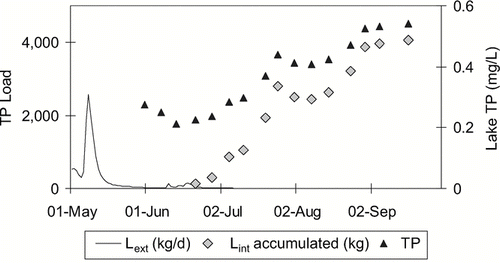
Figure 4 TP and chlorophyll concentration for three growing seasons in polymictic Brome Lake, Quebec.
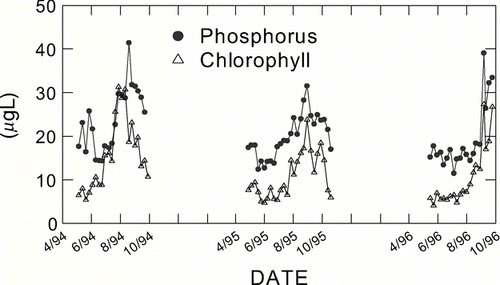
Table 3 Internal load estimates (Lint_1, equation Equation1) for 11 summers (summer, su = May to “End-Date”) from in situ TP concentration changes in polymictic reservoir Lake Mitchell, SD.
Figure 5 Comparison of measured net P retention (Rmeas from mass balance) and predicted gross retention (Rsed) for Cherry Creek Reservoir, Denver, CO (). Differences are due to internal load.
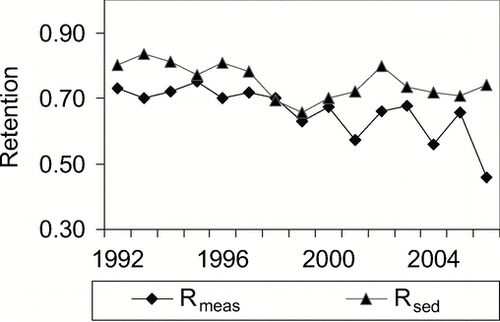
Table 4 Comparison of long-term median net and gross internal load estimates (equation Equation5) according to Method 2 in several water bodies. Years indicates the sample size as the number of years with mass balance estimates.
Figure 6 Comparison of different internal load estimates for polymictic Cherry Creek Reservoir, Denver, CO. Lint_3 estimates are based on a constant RR and moderately variable active areas.
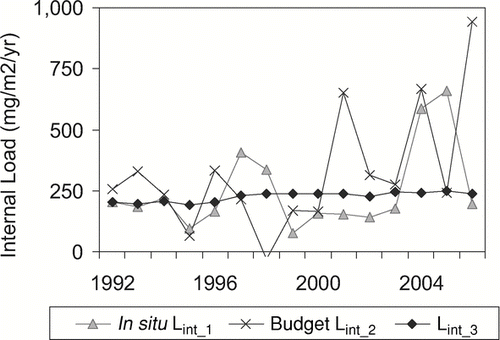
Figure 7 Comparison of different internal load estimates in partially polymictic Lake Pyhäjärvi, Finland. Lint_3 estimates include annual changes in summer temperature. Note that there was a variable biomanipulation effort between years with fish catch exporting as much TP as the outflow. An increasing trend with time is detectable for both estimates (R2 = 0.21 for Lint_2; R2 = 0.43 for Lint_3).
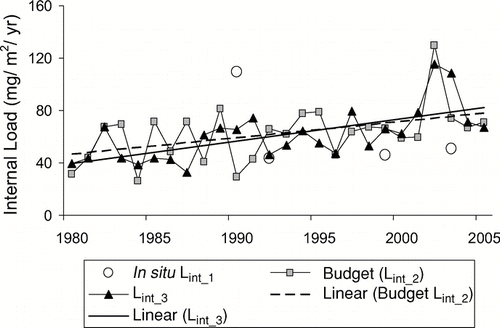
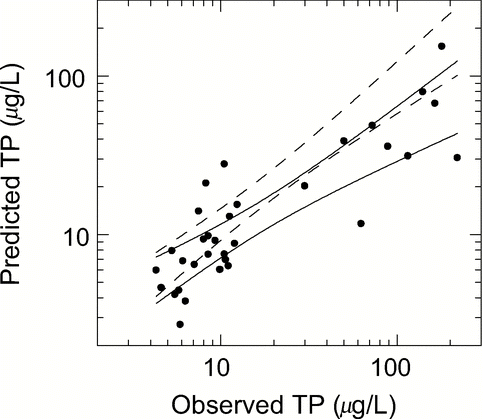
Figure 8 Comparison of observed summer TP averages with those predicted from the TP model (equation Equation18 with Rsed = Rpred of equation Equation14 and Lint) for 33 non-alpine lakes with data from Nürnberg (Citation1998; R2 = 0.84, p < 0.0001, slope is not significantly different from one and t-test on differences is not significant, p = 0.383). The line of perfect prediction (solid) and the 95% confidence band around the regression line (broken) are shown.
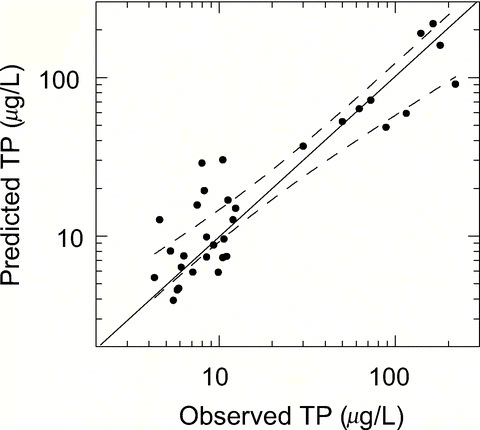
Figure 9 Comparison of observed Jul-Sep TP averages with those predicted from the TP model (equation Equation18 with Rsed = Rτ of equation Equation17 and k = 2.7 and Lint_1) for 15 years of polymictic Cherry Creek Reservoir, Denver, CO (p < 0.01, R2 = 0.38, n = 15). The line of perfect prediction is shown.
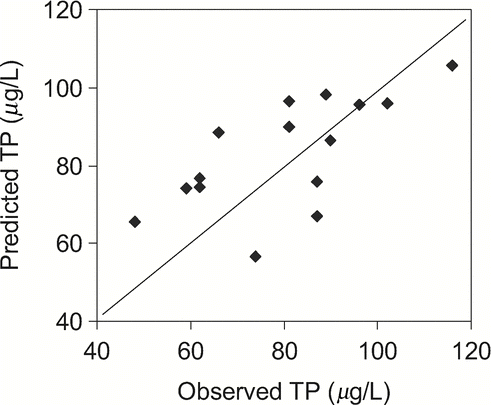
Figure 10 Comparison of observed summer TP averages with those predicted from the Vollenweider model (with Rv of equation Equation13 for v = 10, and no provision for internal load) for 44 stratified, non-alpine lakes (including 33 of , computed with data from CitationNürnberg, 1998. R2 = 0.72, p = 0.0001, n = 44, slope = 0.697, SE = 0.068 significantly different from one, and t-test on differences significant, p < 0.05). The 95% confidence bands are shown (solid). Bands of the TP model of , are shown for comparison (broken).