Figures & data
Figure 1. Patient characteristics. During June 2005 to August 2006, 1988 patients with a variety of urological symptoms were referred from primary care in the Capital Region of Copenhagen, Area North, to The Department of Urology Frederikssund Hospital, Capital Region of Copenhagen, Area North. tPSA, total Prostate Specific Antigen; cPSA, complexed Prostate Specific Antigen; %fPSA, percentage free Prostate Specific Antigen relative to tPSA. All male patients were tested for tPSA, cPSA and %fPSA concentrations in serum. Patients with previously diagnosed PCa were excluded from the dataset. 1)PCa diagnoses (N = 299) were histologically confirmed by a 6–12 core biopsy or prostate resectate. 2)Non-PCa diagnoses (N = 209) were histologically confirmed by a 6–12 core biopsy or prostate resectate. 3)Eight patients with too sparse biopsy material for Gleason staging and five patients not registred for Gleason score. 4)Ninety patients were diagnosed with another malignancy than PCa: C. Testis/Vesica Seminalis (7), C. Coli/Recti (31), and C. Urethrae/Vesica Urinaria (52). 5)Other; Obs. pro c. prostatae (25), non-malignant disease of the testes and vesica seminalis (44), prostate abscess (2), urolithiasis (4), urosepsis (2), hydronephrosis (2), proteinuria (1), gynacomastia (2), pain (7), abnormal urinary cytology (8), and nothing abnormal (7).
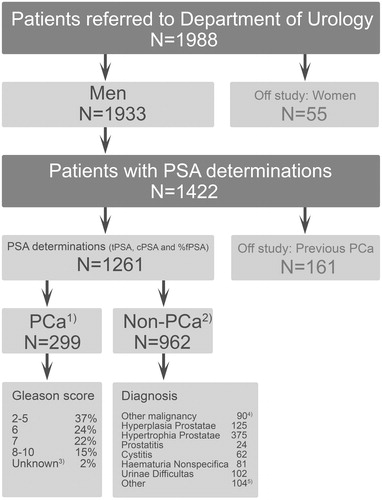
Figure 2. Number of patients with and without PCa within different tPSA and cPSA concentration intervals. Some 299 patients were diagnosed with Prostate Cancer (PCa), and 962 patients were diagnosed as non-PCa. tPSA denotes total Prostate Specific Antigen. cPSA denotes complexed Prostate Specific Antigen. The recommended cut-off for tPSA was 4.0 μg/L, and the recommended cut-off cPSA was 3.6 μg/L.
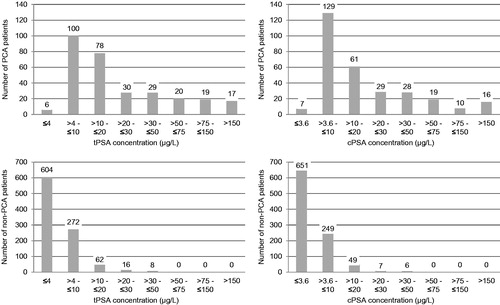
Table 1. Median tPSA values obtained for different age intervals including all 1261 eligible patients.
Table 2. Overall diagnostic performance of tPSA, cPSA and %fPSA among 1261 consecutive patients referred to the Department of Urology from Primary Care.
Table 3. Diagnostic performance of %fPSA within different tPSA concentration intervals among 1261 consecutive patients referred to the Department of Urology from Primary Care.
Table 4. Multivariate Cox Regression Analysis for overall survival and PCa specific survival. Hazard ratios (range).
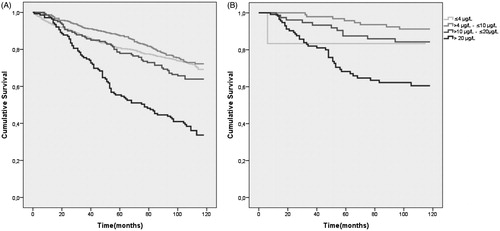
Figure 3. Kaplan-Meier plot of 10-year overall survival (A) and 10-year PCa-specific survival in different tPSA concentration intervals (B). All patients both prostate cancer and non-prostate cancer patients are included in each tPSA concentration interval. PCa denotes patients with prostate cancer. tPSA denotes total Prostate Specific Antigen.