
Figures & data
Table 1. Age distribution of the healthy children and adolescents.
Table 2. Calculated and suggested reference limits. NORIP reference limits are shown for comparison.
Figure 1. Creatinine concentrations (µmol/L) in individual children, separated by gender.
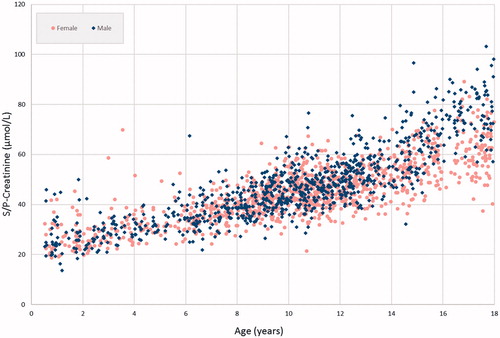
Figure 2. Suggested reference intervals for creatinine for male children from the Colantonio et al.’s study [Citation6], Ceriotto et al.’s study [Citation25] and the two original data sets [Citation9,Citation10], as well as the presently suggested intervals (DEN/SWE). For comparison NORIP [Citation23] intervals for males 18–19 years of age are included.
![Figure 2. Suggested reference intervals for creatinine for male children from the Colantonio et al.’s study [Citation6], Ceriotto et al.’s study [Citation25] and the two original data sets [Citation9,Citation10], as well as the presently suggested intervals (DEN/SWE). For comparison NORIP [Citation23] intervals for males 18–19 years of age are included.](/cms/asset/d2bba508-08dd-4eb8-8c37-f81b6403e5eb/iclb_a_1474493_f0002_c.jpg)
Figure 3. Alkaline phosphatase concentrations (U/L) in individual children, separated by gender.
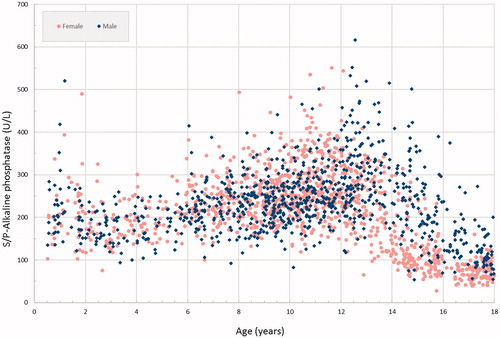
Figure 4. Suggested reference intervals for alkaline phosphatase for females from the CALIPER project [Citation6] and the present data set (DEN/SWE). For comparison NORIP [Citation23] intervals for females 18–19 years of age are included.
![Figure 4. Suggested reference intervals for alkaline phosphatase for females from the CALIPER project [Citation6] and the present data set (DEN/SWE). For comparison NORIP [Citation23] intervals for females 18–19 years of age are included.](/cms/asset/3f2469d2-0fc6-4847-8dc8-d911197d59ba/iclb_a_1474493_f0004_c.jpg)