
Figures & data
Figure 1. Flowchart showing number of patients at each stage of the study.
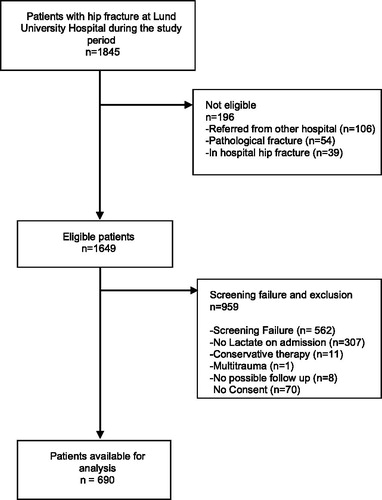
Table 1. Demographics, co-morbidities, laboratory values and vital parameters on admission, choice of anaesthesia, fluid administration and time to operation.
Table 2. Outcomes presented by baseline lactate level.
Table 3. Demographics of the study cohort compared to study site and nationally during the study period.
Figure 2. Histogram showing distribution of lactate concentrations for 30-d mortality (A) and the composite of 30-d mortality and complications secondary outcomes (B).
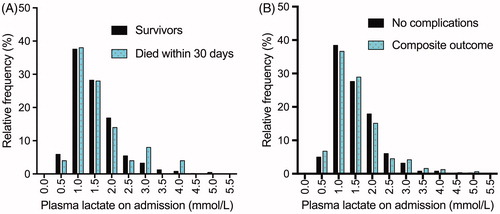
Figure 3. Kaplan–Meier survival curve of patients with lactate concentration< 2.0 mmol/L and ≥2.0 mmol/L. Log rank (Mantel-Cox) significance 0.73. Note that the Y-axis is shortened for clarification.
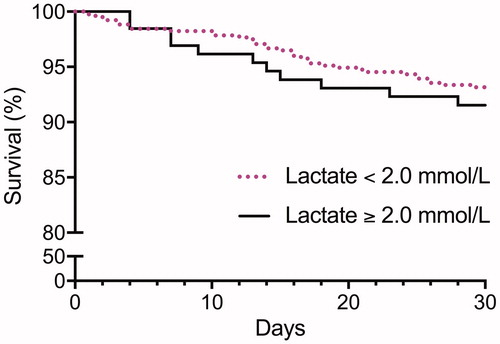
Table 4. Accuracy and predictive qualities for lactate as a predictor of 30-d mortality or a composite outcome (30-d mortality and complications).