4,945
Views
34
CrossRef citations to date
0
Altmetric
Original Article

Comparison of thromboelastometry by ROTEM® Delta and ROTEM® Sigma in women with postpartum haemorrhage

ORCID Icon, , , , , , & show all
Pages 32-38 | Received 20 Jun 2018, Accepted 14 Jan 2019, Published online: 06 Feb 2019

Figures & data

Figure 1. Graphical display of coagulation as provided by ROTEM® devices.

Figure 1. Graphical display of coagulation as provided by ROTEM® devices.

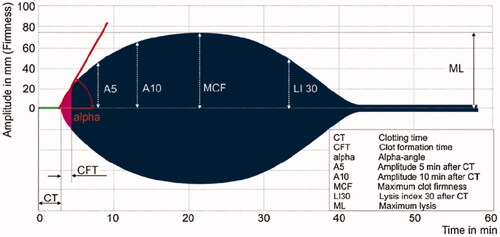
Table 1. Characteristics of the women included.

Figure 2. Scatterplots and Spearman’s correlation coefficients (rs) for EXTEM, INTEM, FIBTEM and APTEM parameters measured on ROTEM® Delta and Sigma devices.

Figure 2. Scatterplots and Spearman’s correlation coefficients (rs) for EXTEM, INTEM, FIBTEM and APTEM parameters measured on ROTEM® Delta and Sigma devices.

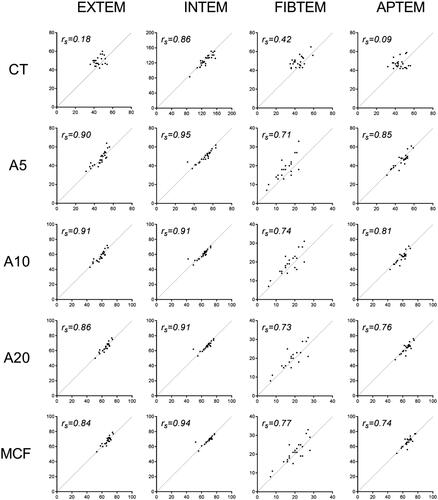
Table 2. Differences between ROTEM® Delta and Sigma for CT, A5, A10, A20 and MCF.a

Table 3. Correlation between ROTEM® Delta and Sigma for CT, A5, A10, A20 and MCF.