Figures & data
Table 1. Preoperative characteristics of the study cohort (n= 4007) presented as either means (± standard deviation) for continuous variables or numbers (percent) for dichotomous variables.
Table 2. Postoperative characteristics of the study cohort (n= 4007) presented as either means (± standard deviation) for continuous variables or numbers (percent) for dichotomous variables.
Figure 1. One- and 3-year mortality in percentage at different ratios of CKD-EPIcystatin C/CKD-EPIcreatinine. Error bars indicate standard error of the mean. Horizontal bars indicate statistical significance in Chi-square tests. CKD-EPI: Chronic Kidney Disease Epidemiology Collaboration.
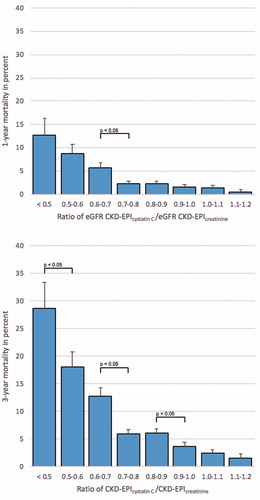
Table 3. Mean eGFR expressed in mL/min/1.73 m2 ± SD and 1- and 3-year mortality (numbers and percentages) at different ratios of CKD-EPIcystatin C/CKD-EPIcreatinine.
Figure 2. One- and 3-year mortality in percentage at different ratios of CAPA/LMrev. Error bars indicate standard error of the mean. Horizontal bars indicate statistical significance in Chi-square tests. CAPA: Caucasian Asian Pediatric Adult; LMrev: Lund Malmö Revised.
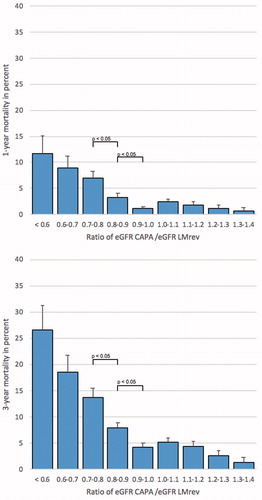
Table 4. Mean eGFR expressed in mL/min/1.73 m2 ± SD and 1- and 3-year mortality (numbers and percentages) at different ratios of CAPA/LMrev.
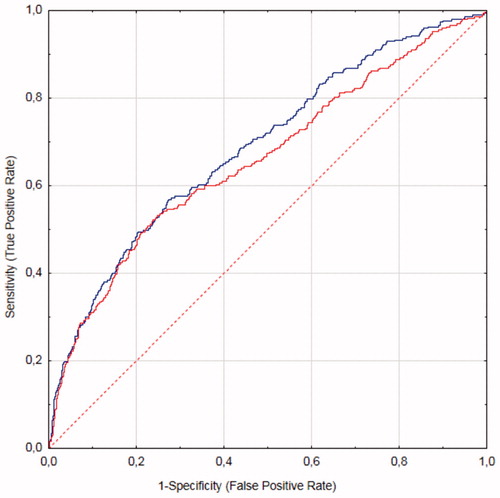
Figure 3. ROC curve plotting ratios of the equation pair CKD-EPIcystatin C/CKD-EPIcreatinine (blue line) and the equation pair CAPA/LMrev (red line) for 1-year mortality. CAPA: Caucasian Asian Pediatric Adult; CKD-EPI: Chronic Kidney Disease Epidemiology Collaboration; LMrev: Lund Malmö Revised; ROC: receiver operating characteristic.
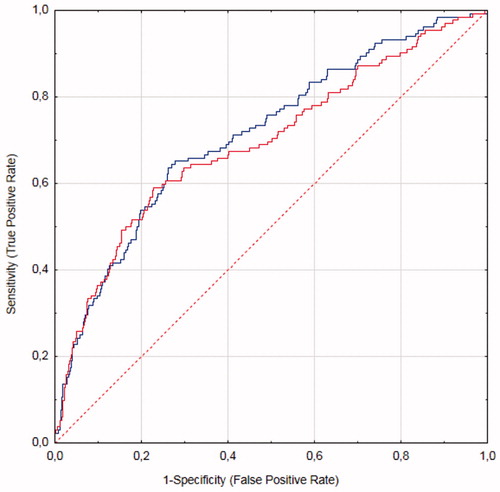
Table 5. Four-field-matrices showing the overlaps for the two equation pairs used for diagnosing SPS.
Table 6. Four-field-matrices showing 1- and 3-year mortalities in percentages separated by a slash.
Figure 4. ROC curve plotting ratios of the equation pair CKD-EPIcystatin C/CKD-EPIcreatinine (blue line) and the equation pair CAPA/LMrev (red line) with 3-year mortality. CAPA: Caucasian Asian Pediatric Adult; CKD-EPI: Chronic Kidney Disease Epidemiology Collaboration; LMrev: Lund Malmö Revised; ROC: receiver operating characteristic.