
Figures & data
Table 1. Baseline characteristics.
Table 2. Estrogen contraceptive use and mean differences in population characteristics, body composition and laboratory investigations among women in the LBA study.
Figure 1. CRP and Orosomucoid as functions of decentiles of body fat percentage for men and women. All variables are z-score transformed. Bars: 95% confidence interval.
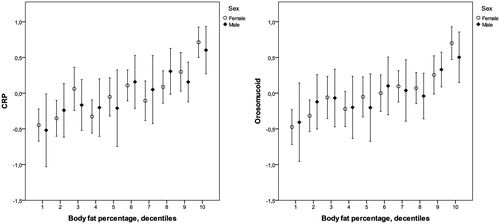
Table 3. Associations of the inflammatory biomarkers CRP and orosomucoid with body fat percentage. All variables were ln transformed and sex-specific z scores were used in the general linear models.
Table 4. Associations of the inflammatory biomarkers CRP and orosomucoid with body fat percentage, stratified for estrogen contraceptive use in the female cohort.