
Figures & data
Figure 1. Western blot analysis of adipose tissue. All four of the ATTR Glu54Leu amyloidosis patients we have investigated showed a unique western blot pattern of TTR.
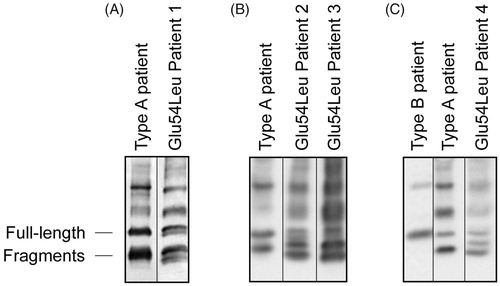
Figure 2. Family pedigree. Relationship of the affected individuals in the Swedish Glu54Leu ATTR family. Arabic numerals refer to the case numbers in the text while the roman numerals refer to the level of generation.
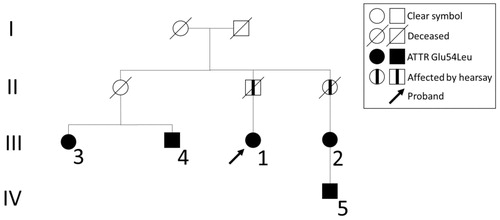
Table 1. Summary of symptoms and findings for each patient.
Table 2. Cardiac biomarkers and echocardiographic findings for each patient.
Data availability statement
Public data sharing is not applicable to this article but portions of the data reported may be available through the corresponding author upon request.