
Figures & data
Figure 1. Linearity of the POC assay system for insulin and C-peptide. The red line and green lines indicate regression lines with linear and non-linear fit, respectively.
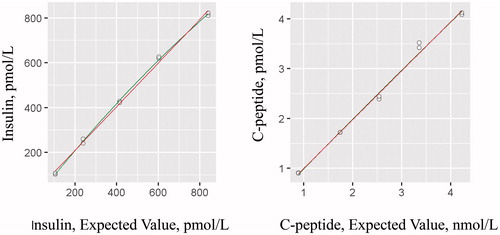
Figure 2. Method comparison for POC assay system and Cobas Elecsys immunoassay system by e60l analyzer for (A) insulin (n = 215, r = 0.957) and (B) C-peptide (n = 201, r = 0.985). Measuring range was 21.81–275.72 pmol/L for insulin and 0.003 nmol/L to 15.21 nmol/L for C-peptide. The slope (95% confidence interval) was 1.259 (1.185–1.344) for insulin and 1.163 (1.120–1.204) for C-peptide. The y intercept (95% confidence interval) was −8.818 (−12.966 to −5.619) for insulin and −0.088 (−0.1192 to 0.0592) for C-peptide. SD of residuals (Syx) was 2.3554 and 0.2622 for insulin and C-peptide, respectively.
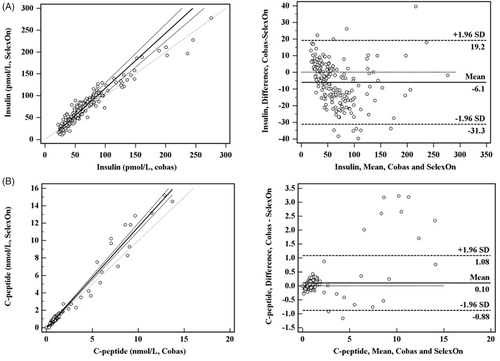
Table 1. Baseline characteristics of normal control and diabetes patients.
Table 2. Receiver operating characteristic curve (ROC) of insulin resistance indices (IRI) of diabetes patients. Equation for HOMA2 index was available at internet site and the variables were entered. Other indices were calculated by the equations.