Figures & data
Figure 1. Expected gain in utility (EGU) as a function of probability of disease for four different clinical actions when the cost of erroneously treating individuals without the disease is 1/3 of the net benefit of correctly treating individuals with the disease. The maximum value of net benefit is conveniently defined as 1. The tests are considered to be risk-free. “Ideal test” and “Dichotomous test” refer to the action of first testing and then treating only individuals with a positive test result. The dichotomous test has a sensitivity of 0.586 and a specificity of 0.959, corresponding to fasting glucose as a dichotomous test (). Three probability thresholds are shown: The treatment threshold (0.25), and the testing (0.02) and test-treatment threshold (0.44) of the dichotomous test. The letter “a” indicates the difference between EGU of the dichotomous test and EGU of treating all, while “b” indicates the difference between EGU of an ideal test and EGU of treating all. The clinical utility index (CUI) is a/b.
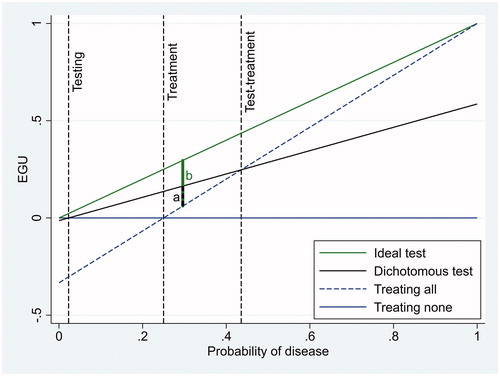
Figure 2. Diagnostic accuracy of fasting glucose and the complete glucose tolerance test when HbA1c ≥48 mmol/mol was used as the reference standard of diabetes mellitus.
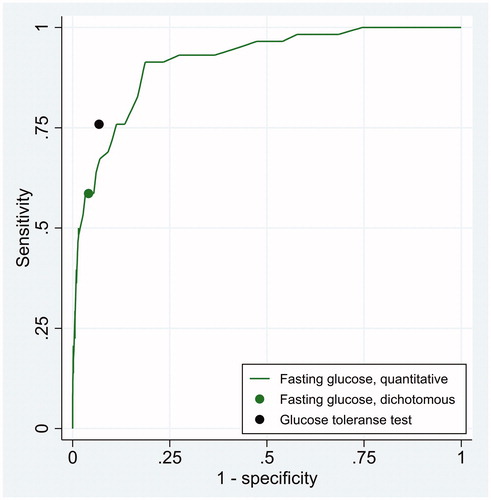
Figure 3. Clinical utility index (CUI) as a function of pretest probability of disease for three diagnostic tests whose diagnostic accuracy is displayed in . The figure refers to a situation where the cost of erroneously treating individuals without the disease is 1/3 of the net benefit of correctly treating individuals with the disease, so that the treatment threshold (black vertical line) is 0.25.
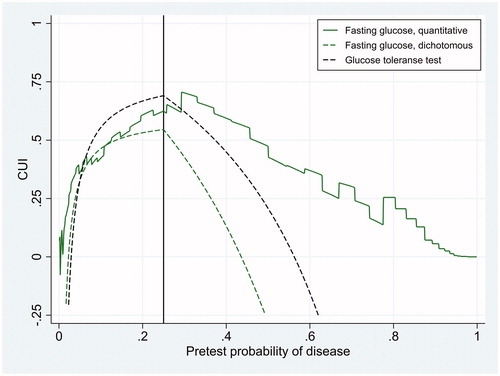
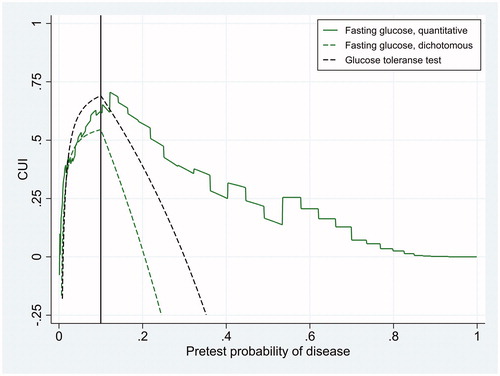
Figure 4. Clinical utility index (CUI) as a function of pretest probability of disease for three diagnostic tests whose diagnostic accuracy is displayed in . The figure refers to a situation where the cost of erroneously treating individuals without the disease is 1/9 of the net benefit of correctly treating individuals with the disease, so that the treatment threshold (black vertical line) is 0.10.