Figures & data
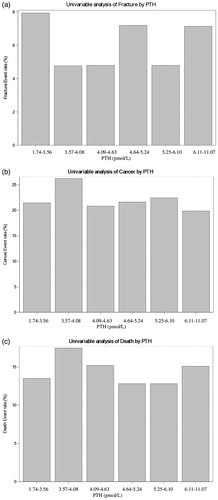
Figure 1. Flowchart of 798 men included in the study on men born in 1943. S-PTH: serum parathyroid hormone (reference range 1.6 – 6.9 pmol/L); S-Ca: albumin-adjusted serum calcium (reference range 2.15 – 2.49 mmol/L); S-25(OH)D: serum 25-hydroxyvitamin D (sufficiency limit ≥ 50 nmol/L); nHPT: normocalcaemic hyperparathyroidism; pHPT: primary hyperparathyroidism; sHPT: secondary hyperparathyroidism (to hypocalcaemia).
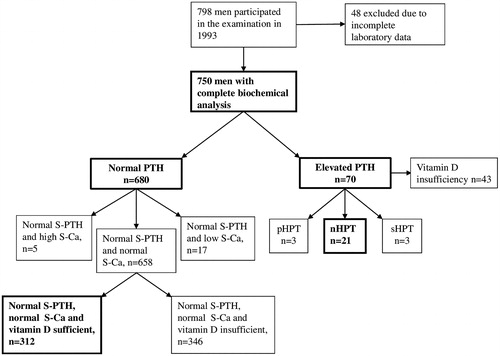
Figure 2. Simple linear regression between albumin-adjusted serum calcium (S-Ca) and serum parathyroid hormone (S-PTH) in a random population sample of 750 men aged 50 years. The circles with cross represent individuals with vitamin D sufficiency (S-25(OH)D ≥ 50 nmol/L).
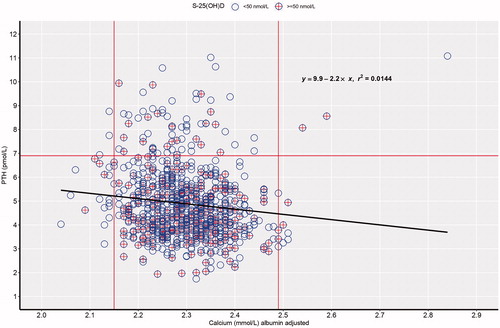
Table 1. Baseline characteristics in men aged 50 years examined in 1993 with hyperparathyroidism (HPT) (n = 70) in comparison with men with normal S-PTH independent of S-Ca or S-25(OH)D level (n = 680).
Table 2. Baseline characteristics in men aged 50 years examined in 1993 with normocalcaemic, vitamin D sufficient hyperparathyroidism (nHPT) (n = 21) and men with normal S-Ca, sufficient S-25(OH)D levels and normal S-PTH (n = 312).
Figure 3. Univariable analyses by steps of serum parathyroid hormone (S-PTH) and incidence of (a) fractures, (b) cancer, and (c) death during 21 years´ follow-up in 750 men aged 50 years at start.