Figures & data
Table 1. Questionnaire responses from the subjects in the study detailing age, height, weight, BMI and alcohol habits (n = 30).
Figure 1. Subject flow of the designed human model. Thirty blood samples were collected at (A) baseline, (B) 3 weeks after the GnRH antagonist (Degeralix) had full effect and (C) 2 weeks after receiving testosterone undecanoate (Nebido®). The results in biomarkers followed were then subjected to paired statistical analysis, and the results were biologically interpreted.
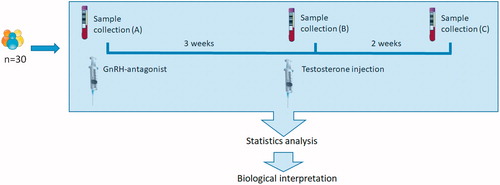
Figure 2. Changes in reproductive hormones due to pharmacological interventions in the individual subject prior to normalization. Subject 1–29 at the three time points: (A) baseline, (B) GnRH antagonist and (C) GnRH antagonist with synthetic testosterone. The subjects are represented by different colors. At time point (C), LH and FSH remain low due to the inhibitory effect of testosterone on the hormonal axis. Due to the administration of synthetic testosterone, testosterone is high in time point (C).
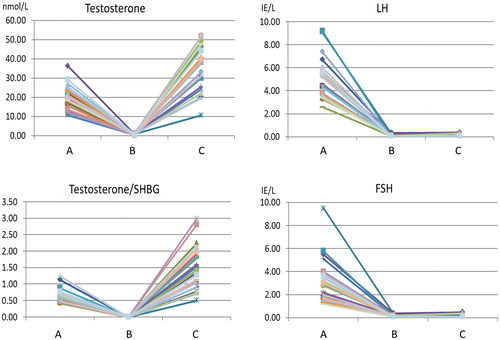
Table 2. Results from statistical tests.Table Footnote*
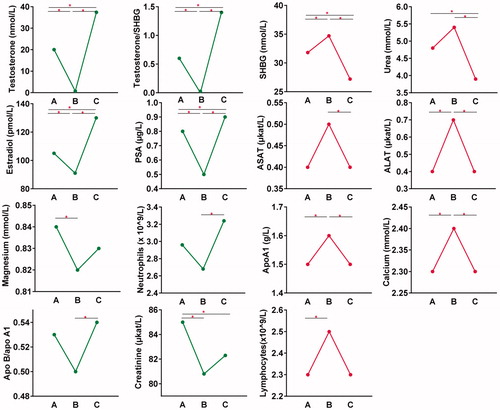
Figure 3. Association patterns of the biomarkers exhibiting statistically significant variations. Biomarkers with a similar pattern to testosterone (two left columns). Biomarkers with an inverse pattern to testosterone (two right columns). On the x axes are the three time points: (A) baseline, (B) GnRH antagonist and (C) GnRH antagonist with synthetic testosterone. Horizontal lines with an asterisk (*) represent significant changes (p-value < .0167) between time points.