Figures & data
Figure 1. The components and design of the study.
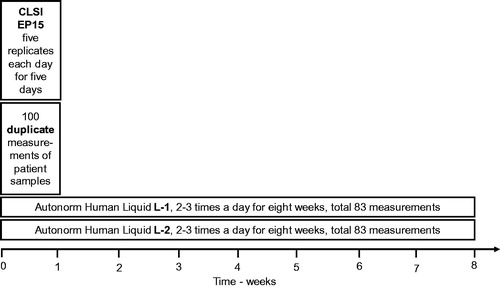
Figure 2. Within and between series variations based on series of five measurements on five occasions (days). One of the results (as shown in the figure) in the first series was regarded as an outlier and not used for further calculations.
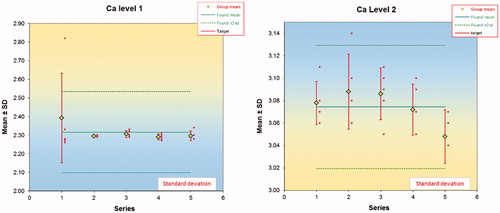
Figure 3. Left panel. The standard deviation (target value 1.12) and confidence interval calculated by the simulation model 5. Each number of observations was simulated 100 times. The vertical line represents the suggested minimal number of observations needed. The corresponding graphs from the other simulations followed the same pattern. Right panel. Standard deviations for ALT, ALP and Ca were calculated using the 100 duplicates using the Dahlberg formula. Solid lines are standard deviations, dotted lines confidence intervals.
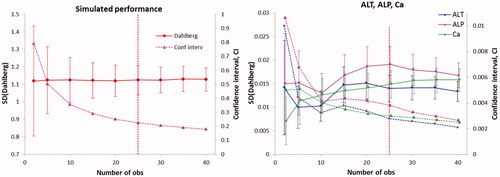
Table 1. Details of analysis of variance components.
Table 2. The imprecision (standard deviation) calculated across all observations and using the method of analysis of variance components from 2 to 6 daily IQC measurements of control material, comprising 83 observations.
Table 3. Properties of duplicate measurements of patient samples.
Table 4. Summary of the simulations of a normally distributed set of 0.5 × 10⁶ simulated results (Orig) from an average of 10 and a standard deviation of 1 and a simulated repeated series with an assumed average difference of 0.25 times a random normality probability function (Rep).
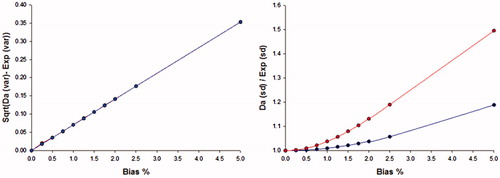
Figure 4. The difference between the Dahlberg standard deviation and that of the Dahlberg expanded formula (as the square root of the difference between the variances), left panel. The difference is linearly related to the relative bias and independent of the assumed random variation of the samples. The ratio (right panel) between the standard deviation estimated by the Dahlberg and Expanded Dahlberg formulas. The random difference between series was 2.5%.