Figures & data
Table 1. Number of duplicate observations (rounded down to the nearest hundred) within the interval indicated in the parenthesis.
Table 2. Number observations in each of the partitions analyzed by the ANOC. Concentration intervals as in .
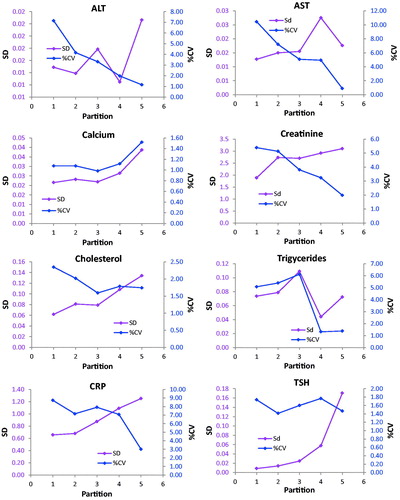
Figure 1. Repeatability profiles based on 10 sets of1,000 duplicates. Absolute uncertainty (SS) are shown on the left Y-axis, relative uncertainty on the right axis. The X-axis shows the partitions (1–5), the corresponding concentration intervals are reported in . Error bars represent the IQR.
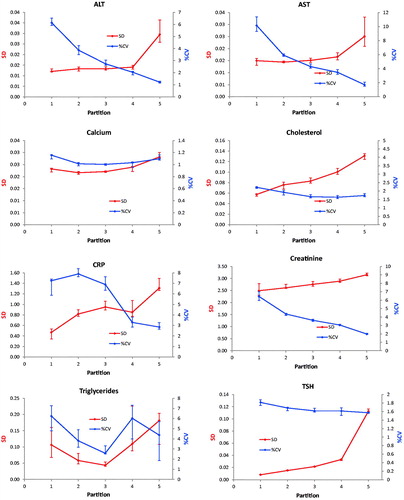
Figure 2. Repeatability profiles based on 30 sets of 25 duplicates. Absolute uncertainty (SD) are shown on the left Y-axis, relative uncertainty on the right axis. The X-axis shows the average concentration of the partitions. The concentration of the fifth partition has been selectively reduced to make the diagrams more readable. Error bars represent the IQR.
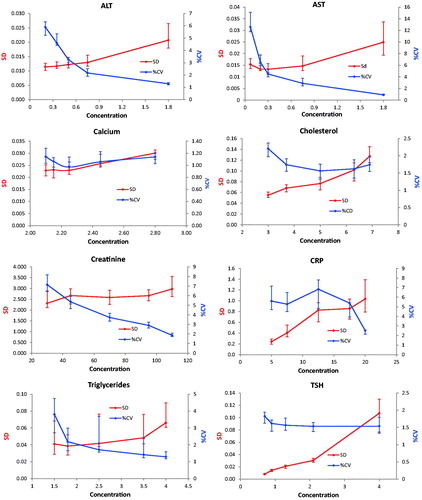
Table 3. The medians and 25- and 75 percentiles of results calculated from 10 repeated selections of 1,000 unique results. The minimal differences are based on the repeatability standard deviation in each partition.
Table 4. The medians and interquartile intervals were based on 30 groups of 750 pairs of observations after randomization of the initial dataset.
Figure 3. Repeatability profiles generated by ANOC analysis of the entire database.