Figures & data
Table 1. Clinical characteristics of subjects in Cohort I.
Table 2. Clinical characteristics of subjects in cohort II.
Figure 1. Individual data for insulin secretion. Measured as HOMA2-B in cohort I (A) and cohort II (B), and as iAUC0–8 min in cohort I (C) and in cohort II (D). iAUC0–8 min: incremental area under the curve for the first phase (0–8 min) insulin response to glucose.
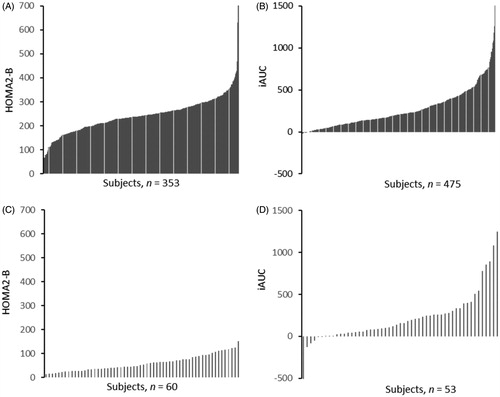
Table 3. Variation in insulin secretion indices for subjects in cohorts I and II.
Figure 2. Individual data for insulin resistance. Measured as HOMA2-IR in cohort I (A) and cohort II (B), and as SI in cohort I (C) and as TGD in cohort II (D). HOMA2-IR: homeostatic model assessment for insulin resistance, SI: insulin sensitivity index; TGD: total glucose disposal.
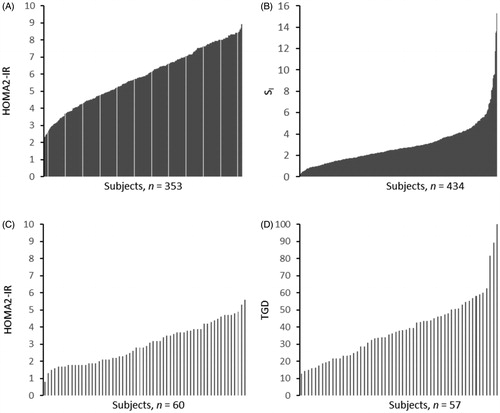
Table 4. Variation in insulin resistance or insulin sensitivity indices for subjects in cohorts I and II.
Table 5. Variation in components of the metabolic syndrome for subjects in cohorts I and II.
Figure 3. Relationship between insulin sensitivity (SI) and first-phase insulin secretion (iAUC) across different categories of fasting plasma glucose in cohort 1. Green points: subjects with fasting plasma glucose <5.6 mmol/L, orange points: subjects with fasting plasma glucose 5.6–7.0 mmol/L and red points: subjects with fasting plasma glucose >7.0 mmol/L. The green trend line shows the log-hyperbola relationship between insulin sensitivity and secretion within those with normal fasting plasma glucose. iAUC0–8 min: incremental area under the curve for the first phase (0–8 min) insulin response to glucose.
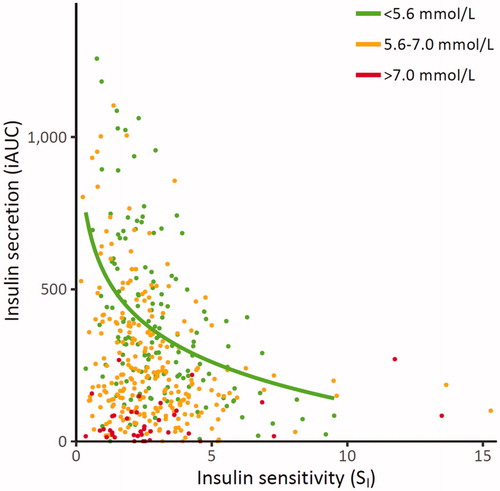
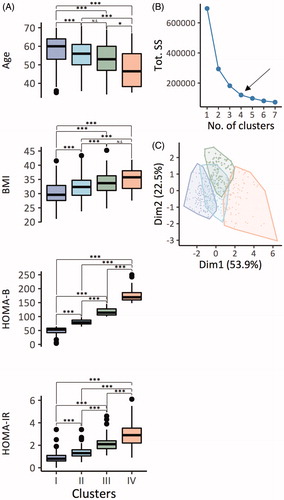
Figure 4. Distribution of MetS patients (n = 486) according to k-means clustering. (A) Pairwise comparison of age, BMI, HOMA-B and HOMA-IR between patients in the identified four clusters. The comparison was made using ANOVA with Tukey HSD post hoc correction for multiple testing. (B) The optimal number of clusters was chosen using the elbow-method. (C) Clustering of patients according to k means and principal component analysis. ***p< .001, **p< .01 and *p< .05. N.S: not significant. Tot. SS: total within the sum of squares. Dim1/2 = principal component 1/2.