Figures & data
Table 1. Demographic details of the patients included in the study.
Figure 1. Representative images from differentiated mesenchymal stem cells. A–D: bone marrow mesenchymal cells, BMSCs and E–H: adipose derived mesenchymal cells, ADSCs. Panel B and F are stained with Red Oil for adipocyte identification. Panel C and G are stained with Alcian Blue for chondrocyte identification. Panel D and H are stained with Alizarian Red for osteoblast identification.
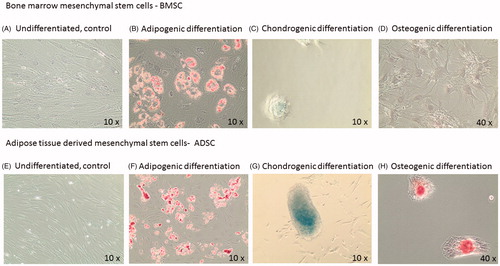
Figure 2. Analysis of positive and negative cell surface antigen expression in expansions of bone-marrow derived mesenchymal stem cells, BMSCs (top row) and adipose tissue derived mesenchymal stem cells, ADSCs (bottom row). Representative plots from one study participant. Percentage (%) of positive cells are shown in each peak for markers CD105, CD73, CD90 and for the cells lacking the negative cocktail containing CD34, CD11b, CD19, CD45, HLA-DR. Gating was performed using isotype control and unstained cells (data not shown).
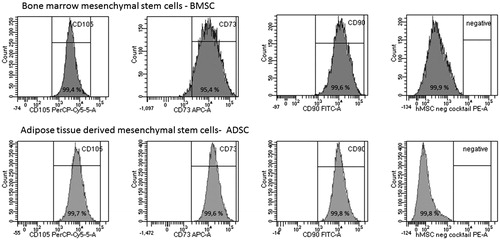
Figure 3. Time to confluency (days) versus yield (total cell number) for passage 1 and 2, paired samples from donor 1 to 6. Top diagram, A: shows growth and yield for bone marrow mesenchymal stem cells (BMSCs) and bottom diagram, B: adipose tissue derived mesenchymal stem cells (ADSCs). On average, 80% confluency was reached in 13 ± 4 days (ADSCs) and 24 ± 6 days (BMSCs), passage 1, and 11 ± 2 days (ADSCs) and 17 ± 5 days (BMSCs), passage 2. After the second passage, the yield was numerically higher from ADSCs compared with BMSCs, although, this did not reach significance.
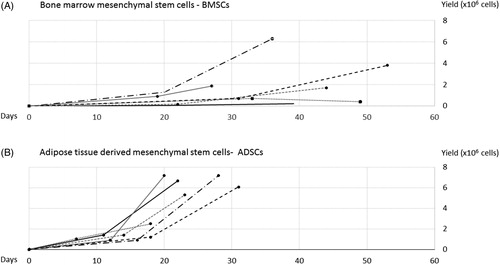
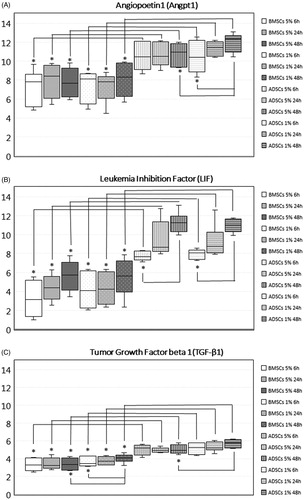
Figure 4. Gene expression of target genes in MSCs from different tissues and/or MSCs exposed to different oxygen concentration. Data expressed as box plots; median values, standard deviations and range for adipose tissue derived stem cells (ADSCs) and bone marrow derived stem cells (BMSCs) cultured for 6, 24 and 48 h in 5% O2 and 1% O2. Significant differences between groups are defined as p value below .001 and marked with *. ADSCs expressed significantly higher levels of angiopoetin1 (Angpt1), leukemia inhibition factor (LIF) and tumor growth factor beta 1 (TGF-β1) compared to BMSC, both when cultured in 5% O2, and when cultured in 1% O2 at all examined time points. The expression of Angpt1 increased over time in ADSCs 1% O2, and was after 48 h significantly higher compared to ADSCs 1% O2 cultured for 6 h, and compared to ADSCs 5% O2. The expression of LIF increased over time in ADSCs but not in BMSCs, and was significantly higher after 48 h compared to 6 h. The expression of TGF-β1 increased in BMSCs 1% O2 and was significantly upregulated after 48 h compared to 6 h. Due to the increased expression of TGF-β1 in BMSCs 1% O2, expression was significantly higher after 48 h in BMSCs 1% O2 compared to BMSCs 5% O2. In ADSCs, the expression also increased but the increase did not reach significance. However, after 48 h, the expression of TGF-β1 was significantly higher in ADSCs 1% O2 compared to ADSCs 5% O2.