
Figures & data
Table 1. Basic characteristics of the Lund Cystatin C standardization cohort, stratified by the quartiles of the ratio of estimated GFR according to CAPACYS and LMRCR.
Figure 1. Distribution of the eGFRCYS/eGFRCR-ratio, calculated using three pairs of eGFR equations. CAPACYS and LMRCR [Citation19,Citation25]. CKD-EPICYS and CKD-EPICR [Citation26]. FASCYS and FASCR [Citation27].
![Figure 1. Distribution of the eGFRCYS/eGFRCR-ratio, calculated using three pairs of eGFR equations. CAPACYS and LMRCR [Citation19,Citation25]. CKD-EPICYS and CKD-EPICR [Citation26]. FASCYS and FASCR [Citation27].](/cms/asset/25537a47-7ba5-4146-a0ce-33478921b062/iclb_a_1759139_f0001_c.jpg)
Figure 2. Survival stratified on the quartiles of the ratio of estimated GFR using the CAPACYS and LMRCR equations (<0.70, 0.70–0.84, 0.85–0.99 and ≥ 1.00) for all 1332 female (A) and 1449 male (B) patients.
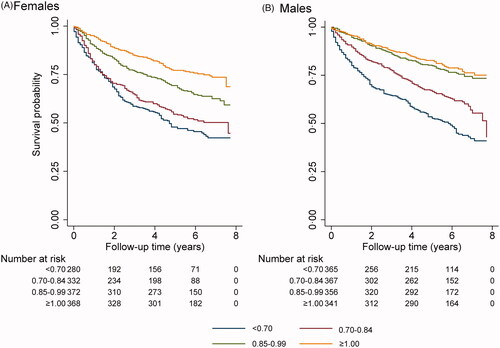
Table 2. Cox regression for all-cause mortality in the Lund Cystatin C standardization cohort (n = 2781).
Table 3. Cox regression for all-cause mortality in the Lund Cystatin C standardization cohort stratified by sex (males; n = 1429, and females; n = 1352)
Figure 3. Survival stratified on 6 groups for the ratio of estimated GFR using the CAPACYS and LMRCR equations (six groups; <0.60, 0.60–0.69, 0.70–0.84, 0.85–0.99, 1.00–1.09 and ≥1.10) for all 2781 patients.
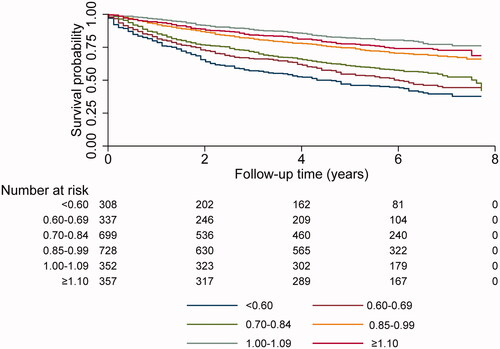
Table 4. Cox regression for all-cause mortality in the Lund Cystatin C standardization cohort (n = 2781) using 6 groups for the CAPACYS/LMRCR ratio.
Table 5. Cox regression for all-cause mortality in the Lund Cystatin C standardization cohort (n = 2781) using eGFRCYS/eGFRCR-ratio intervals based on the CKD-EPI equations.
Table 6. Cox regression for all-cause mortality in the Lund Cystatin C standardization cohort (n = 2781) using eGFRCYS/eGFRCRc ratio intervals based on the FAS equations.
Table 7. Cox regression for cause-specific mortality in the Lund Cystatin C standardization cohort (n = 2781).
Table 8. Cox regression for all-cause mortality in three sub-cohorts, patients with no prior diagnosis (n = 1049), patients with normal measured GFR (≥60 mL/min/1.73m2; n = 1300), and patients with both normal mGFR and no prior diagnosis (n = 567).
Table 9. Total all-cause mortality (%), prevalence (%) of SPS and hazard ratios (HR) for all-cause mortality using different eGFRCYS/eGFRCR-ratios for the SPS diagnosis.
Table 10. Cox regression for all-cause mortality in the Lund Cystatin C standardization cohort (n = 2781), when excluding CAPACYS, LMRCR and mGFR, both one at a time and simultaneously.