
Figures & data
Figure 1. Flowchart of study design.
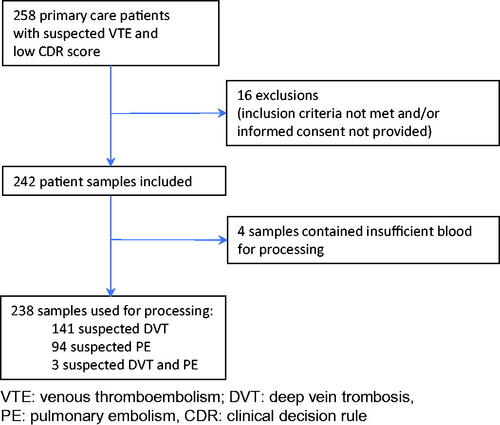
Table 1. Imprecision data of the Point-of-Care (POC) D-dimer assays used in this study.
Figure 2. Bland-Altman plots comparing Point-of-Care (POC) D-dimer results of (A) Nano-Checker 710, (B) AFIAS-1, (C) iChroma-II, (D) Standard F200, (E) Hipro AFS/1 assays with D-dimer results of our laboratory (lab) assay (STA-Liatest PLUS). The dotted lines indicate mean differences between POC assays and lab assays, while the dashed lines indicate their 95% confidence intervals. Corresponding values are presented in (third column).
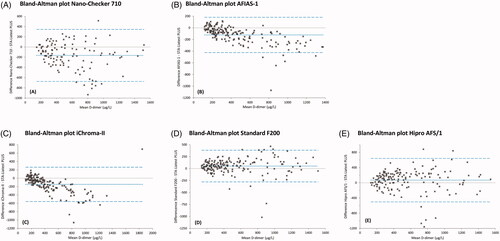
Table 2. Results of method comparison of five Point-of-Care D-dimer assays with the STA-Liatest PLUS.
Table 3. Concordance and discordance of all Point-of-Care assays versus the STA-Liatest PLUS assay. Data are based on dichotomous results (positive/negative) with a 500 μg/L cut-off value.
Table 4. Device characteristics and user-friendliness of Point-of-Care D-dimer devices used in this study.