
Figures & data
Table 1. Study group characteristics.
Figure 1. Correlation between the maximum clot firmness (MCF) of the FIBTEM assay and early FIBTEM parameters (clot firmness at 5 (A5) or 10 (A10) min).
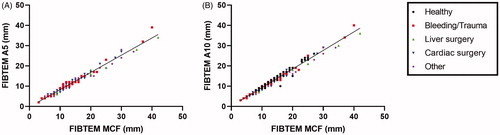
Table 2. Correlation between fibrinogen level (Clauss assay) or the FIBTEM α–angle and FIBTEM clot firmness parameters.
Figure 2. Correlation between fibrinogen concentrations measured by the Clauss assay and maximum clot firmness (MCF) of the FIBTEM assay.
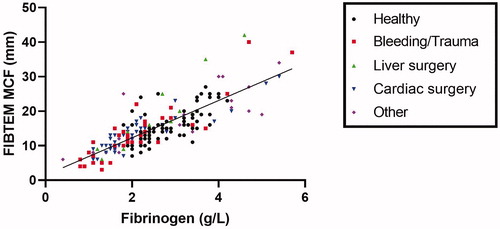
Figure 3. Agreement between classification in low, normal and high levels according to the Clauss assay and FIBTEM parameters clot firmness at 5 (A5) or 10 (A10) min or maximum clot firmness (MCF).
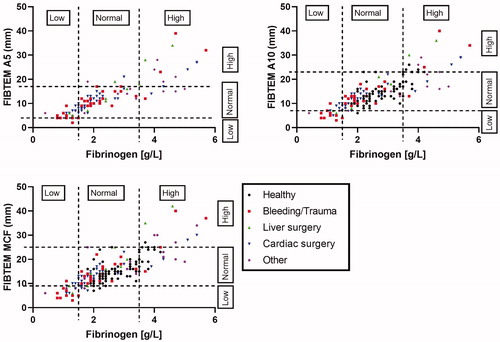
Table 3. Agreement between the Clauss assay and FIBTEM parameters in classification in low, normal or high fibrinogen.
Table 4. Optimal cut-off values of FIBTEM parameters for fibrinogen levels ≤1.5 g/L.