
Figures & data
Figure 1. Time course of the changes in concentrations of the markers after hypothermic circulatory arrest (median and interquartile range, n = 16–17 for days 0–7 and n = 8–9 for day 8–10, except for hCG n = 11 and 6, respectively). Day 0 is the baseline sample, collected right before anesthesia induction. Dashed lines show the upper reference limit of the markers. *The upper reference limit for hCG varies between 1 and 7 IU/l depending on age and gender (see ). One outlier value of trypsin-2–API has been removed.
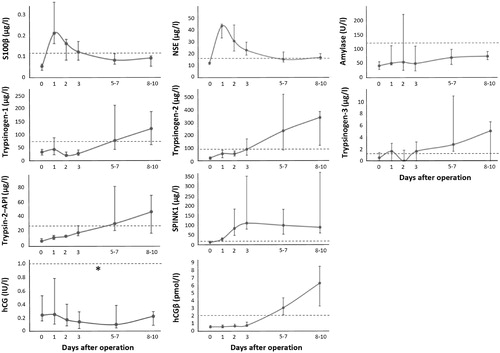
Table 1. The baseline and postoperative concentrations of the studied markers.