Figures & data
Table 1. Demographic information of all subjects used in this study.
Table 2. Primers used in this study.
Table 3. Performance of different panels of mRNA biomarkers and CEA in the discovery phase and validation phase.
Figure 1. Flowchart of the discovery phase and validation phase to detect ovarian cancer.
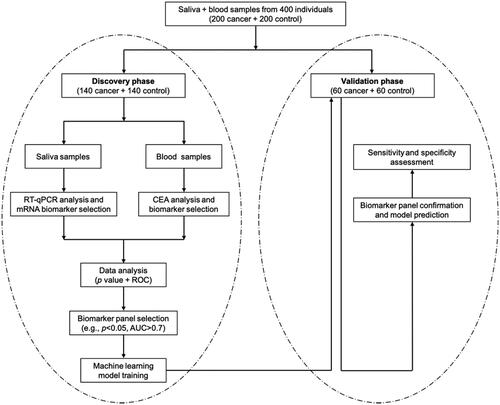
Figure 2. Comparison of RNA expression levels of five candiate genes in saliva samples and CEA levels in blood samples between healthy control group (blue) and ovarian cancer patient group (red) in the discovery phase. The healthy control group included 140 normal people; the ovarian cancer patient group included 140 patients. *indicates p < .05; **indicates p < .01; ***indicates p < .001; ns indicates p > .05.
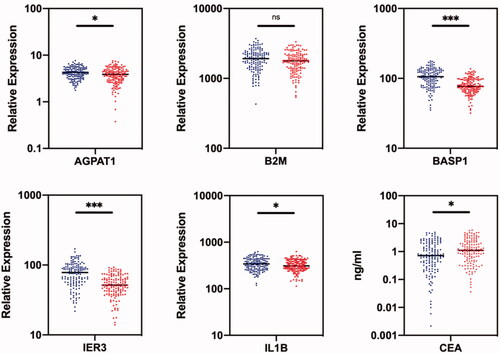
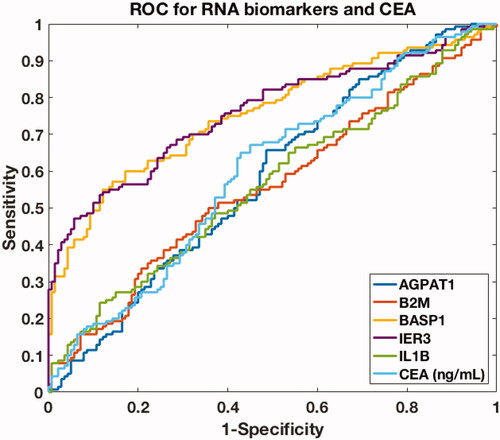
Figure 3. ROC curves of single biomarkers (AGPAT1, B2M, BASP1, IER3, IL1β) in saliva and CEA level in blood in the discovery phase.