
Figures & data
Table 1. Precisions of Hcy assays.
Figure 1. Comparison of Architect immunoassay and BSBE enzymatic assay by Passing–Bablok regression analysis (A) and Bland–Altman analysis (B).
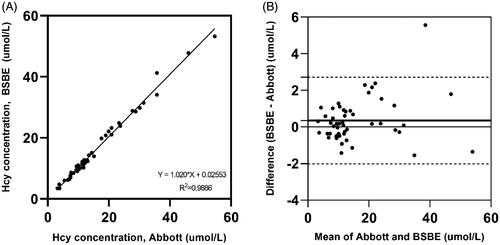
Figure 2. Linearity test on five different levels of Hcy were measure by BSBE enzymatic assay. The linearity of the assay was 0.5–53.3 µmol/L.
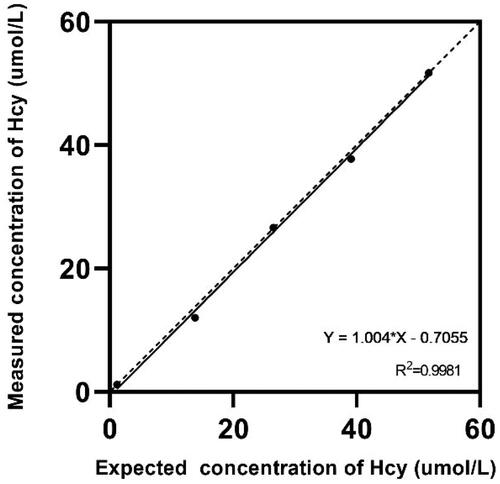
Table 2. Recovery rate.
Table 3. Accuracy test results from the insert provided by the manufacturer.