
Figures & data
Table 1. Baseline characteristics of participants in Lolland-Falster Health Study aged 18 + years: Determinants, 2016–2019.
Table 2. Baseline characteristics of reference population.
Table 3. Lower and upper limits for reference intervals in apparently healthy males and females.
Figure 1. Relative change and 90% confidence intervals of LOFUS reference values compared to NORIP values, lower limit. Relative change is computed as (XLOFUS - XNORIP)/XNORIP, and similarly for confidence limits. Black dots denote relative changes whose confidence interval overlaps zero (dashed line).
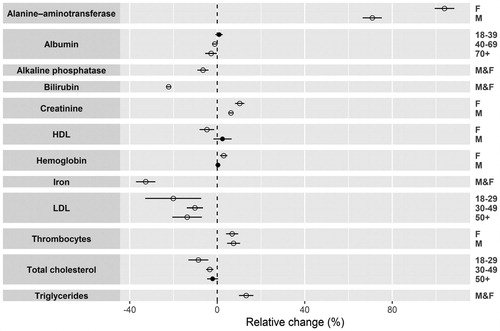
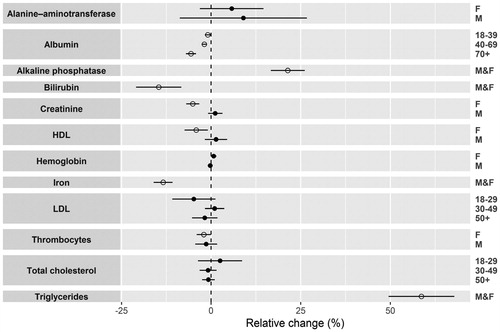
Figure 2. Relative change and 90% confidence intervals of LOFUS reference values compared to NORIP values, upper limit. Relative change is computed as (XLOFUS - XNORIP)/XNORIP, and similarly for confidence limits. Black dots denote relative changes whose confidence interval overlaps zero (dashed line).
Supplemental Material
Download MS Word (34.2 KB)Data availability statement
Data from the study can be made available via Region Zealand following the Danish Data Protection Regulation.