
Figures & data
Figure 1. FASage (ml/min/1.73 m2) plotted against FAScys (ml/min/1.73m2) with the intersection lines representing 40% of the respective axis.
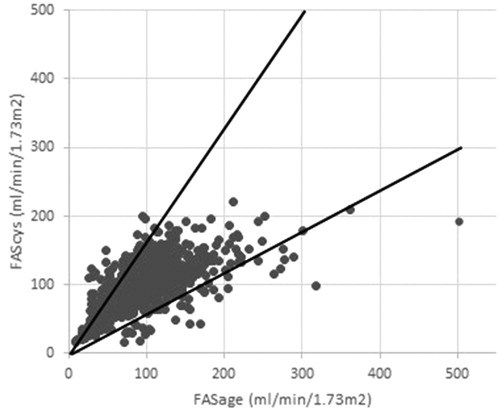
Figure 2. FASage (ml/min/1.73 m2) plotted against FAScys (ml/min/1.73m2) in patients with neural tube defects (a) and patients with nephritis (b) with the intersection lines representing 40% of the respective axis.
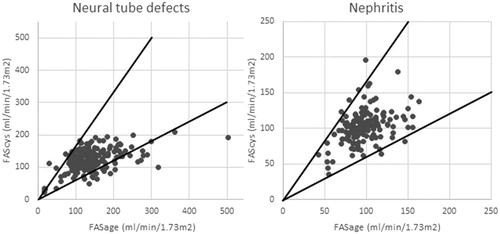
Table 1. Differences in median levels or prevalences of different variables between the high agreement (|ΔeGFR| ≤ 40%) and the low agreement (|ΔeGFR| > 40%) groups.