Figures & data
Figure 1. Cell counts of leukocytes (total) and neutrophils in blood plotted against the whole blood calprotectin concentration in 77 patients. Both axes are logarithmic.
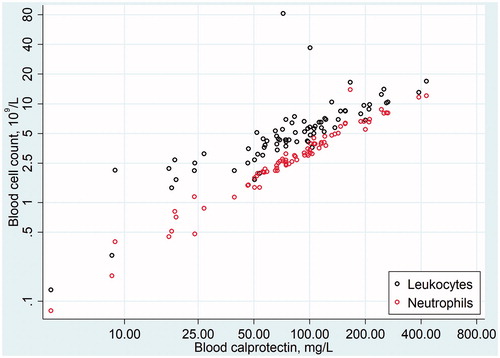
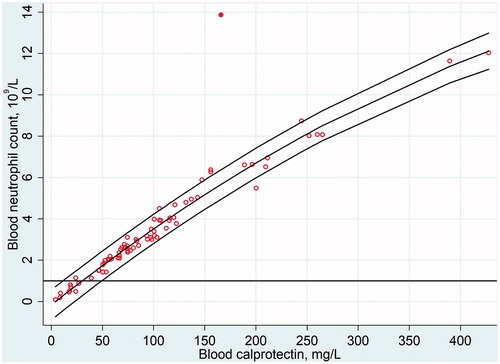
Figure 2. Cell counts of neutrophils in blood plotted against the whole blood calprotectin concentration in 77 patients. One patient with an exceptionally low whole blood calprotectin concentration per neutrophil (12 pg) is seen at the top. The neutrophil count as a function of the whole blood calprotectin concentration is shown, along with the 95% prediction interval (for new observations). The horizontal line indicates a neutrophil count of 1 × 10⁹/L.