Figures & data
Figure 1. The correlation between blood neutrophil counts and Myeloperoxidase in extracted whole blood in an unselected hospitalized group of patients. The left panel shows all patient data (r = 0.95) and the right panel only results of patients with neutropenia i.e. blood neutrophils <2 × 10⁹/L (r = 0.99).
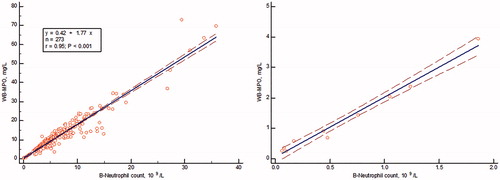
Figure 2. The concentrations in extracts of whole-blood (a) Myeloperoxidase (right panel), (b) Lactoferrin (left panel) in samples from patients with ALL (Acute lymphocytic leukemia), AML (Acute myeloid leukemia), APL (Acute promyelocytic leukemia), T-ALL (T-cell Acute lymphocytic leukemia) and A (Adult controls). The results are represented by a logarithmic y-axis. The statistics is shown on the figure.
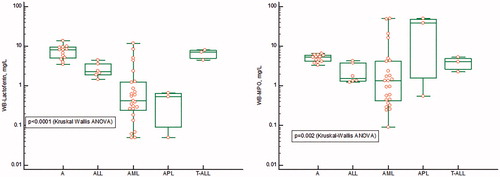
Figure 3. The MPO/LF ratio in samples from patients with ALL (Acute lymphocytic leukemia), AML (Acute myeloid leukemia), APL (acute promyelocytic leukemia), T-ALL (T-cell acute lymphocytic leukemia) and A (adult controls). The results are represented by a logarithmic y-axis. The statistics is shown on the figure.
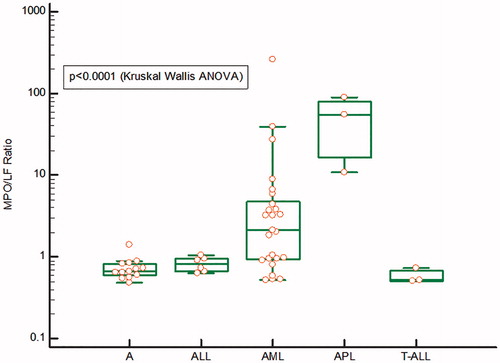
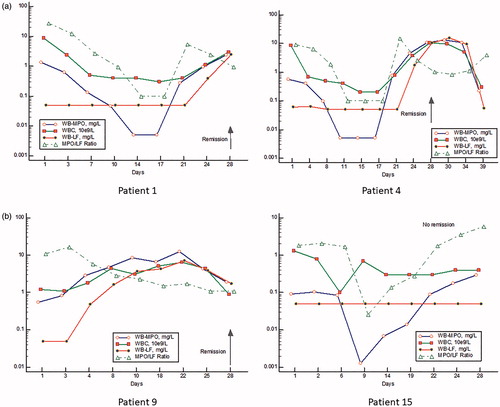
Figure 4. (a, b) The monitoring of whole-blood MPO and LF, the MPO/LF ratio and WBC before, during and after remission treatment in four patients of which three experienced a morphological remission and one patient (no 15) showed no remission. The results are represented by a logarithmic y-axis.