
Figures & data
Table 1. For each analyte, the total number of individuals with two analytical results and age at least 18 years (at least 20 for cholesterol) are given, along with the numbers meeting the exclusion criteria CRP above 10 mg/L or missing, and the concentration of at least one analytical result being outside the reference range. Next, the numbers of outliers are given, then the total number of included individuals with their fraction of women and the median age of women and men.
Figure 1. Individual changes in analyte concentration from the first to the second sample plotted against the concentration in the first sample for albumin (a), calcium (b), cholesterol (c), phosphate (d), potassium (e), sodium (f), hemoglobin (g) and thrombocytes (h). In order to reduce the problem of overlapping points, 2% random noise was added. Also shown are the empirical 5 and 95 percentiles with their 95% confidence areas, in addition to the limits of reference change values (red lines).
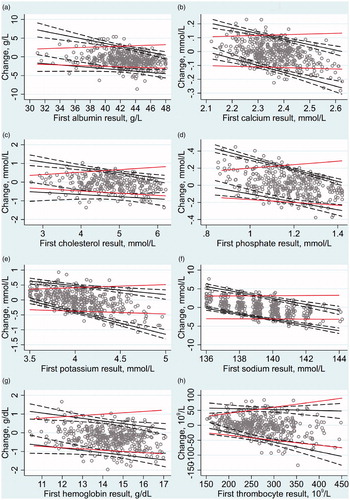
Table 2. Results of the quantile regression analyses showing the empirical 5 and 95 percentiles (95% confidence intervals) as functions of the first analytical result.
Table 3. For each analyte, the analytical coefficient of variation (CVA) from NHANES [Citation13,Citation14] and normal within-subject biological coefficients of variation (CVI) from the EFLM Working Group on Biological Variation [Citation4–6] are listed, in addition to the limits of low (5%) and high (95%) reference change values (RCV). All figures are percentages.
Table 4. The diagnostic accuracy of the 5% and 95% RCVs in detecting changes from the first to the second sample outside or inside the 5 and the 95 percentiles in the distributions of observed changes. Point estimates with 95% confidence intervals in parenthesis are given.