Figures & data
Table 1. Clinical characteristic in the REBUS and the VaMIS cohort.
Figure 1. Empirical cumulative density function (ECDF) plots of the significant biomarkers: TNFRSF-14: tumor necrosis factor receptor superfamily member 14; TNFR-1: tumor necrosis factor receptor 1; TNFR-2: tumor necrosis factor receptor 2; GDF-15: growth differentiation factor 15; UPAR: urokinase plasminogen activator surface receptor; FABP-4: fatty acid-binding protein adipocyte; Nt-pro BNP, CSTB, Cystatin B, CHI3L, chitinase-3-like protein 1, in the univariate analysis in patients with and without multisite artery disease (MSAD), as measured by peripheral artery disease. Patients with MSAD showed a red dotted line and patients without MSAD with a green dotted line.
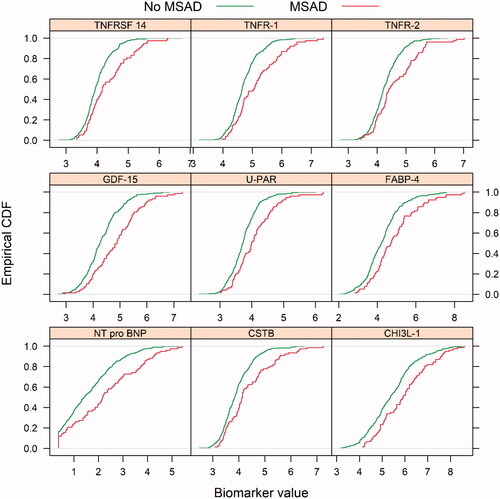
Figure 2. Prediction model with random forest for prediction of patients with multisite artery disease, as measured by peripheral artery disease in the REBUS cohort. The biomarkers presented with the highest variable importance: TNFR-1: tumor necrosis factor receptor 1; GDF-15: growth differentiation factor 15; RETN: resistin; IL-1 RT1: interleukin-1 receptor type 1; JAM A: junctional adhesion molecule A; TNFR-2: tumor necrosis factor receptor 2; EGFR: epidermal growth factor receptor; TNFRSF-14: tumor necrosis factor receptor superfamily member 14; CPB 1: carboxypeptidase B; Nt-pro BNP; IL-6 RA: interleukin-6 receptor subunit alpha Nt-pro BNP; CSTB: cystatin B.
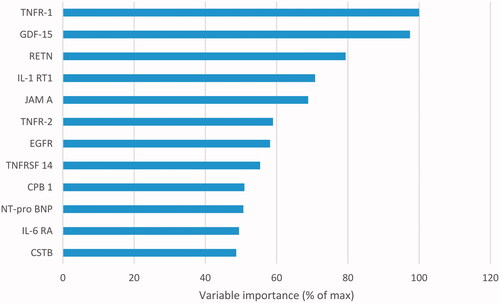
Table 2. Additional predictive value of the biomarkers compared to the performance of the model with clinical characteristics, as measured by the c-statistic.
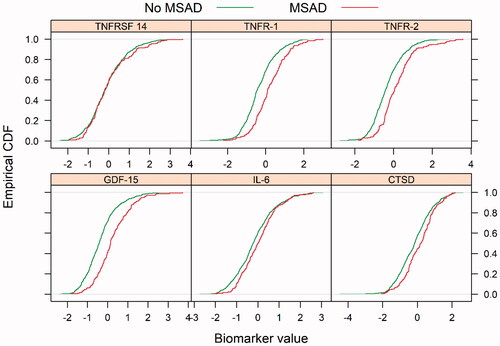
Figure 3. Empirical cumulative density function (ECDF) plots for biomarkers; TNFRSF-14: tumor necrosis factor receptor superfamily member 14; TNFR-1: tumor necrosis factor receptor 1; TNFR-2: tumor necrosis factor receptor 2; GDF-15: growth differentiation factor 15; IL-6 RA: interleukin-6 receptor subunit alpha; CTSD: cathepsin D, in patients with and without multisite artery disease (MSAD), measured by peripheral artery disease in the VaMIS cohort. Patients with MSAD showed a red dotted line and patients without MSAD with a green dotted line.