
Figures & data
Figure 1. CONSORT flow diagram. Unselected urine samples from all patients with a microbiological test results were included in the All Patient group, while only elderly patients (≥65 years) presenting at the emergency department were included in the Elderly patients at ED group. Indications for requesting urine culture and symptoms were unknown. Some data were unavailable. Patient identification (ID), emergency department (ED)
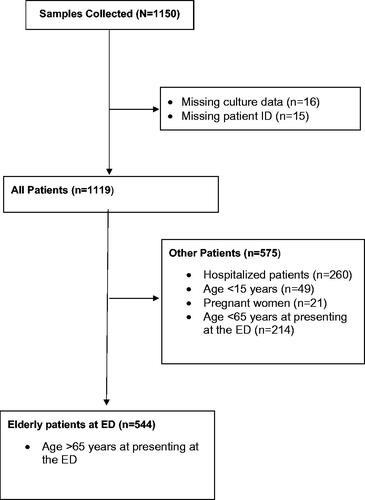
Table 1. Inter assay coefficients of variation for bacterial, leucocyte, and erythrocyte counts on a Sysmex UF-5000.
Figure 2. Distribution of bacterial counts and leucocyte counts measured by UF-5000 according to the observed CFB/L by urine culture. A) All Patient group; B) Elderly patients at ED group (>65 years) presenting at the emergency department. Positive urine cultures were grown with ≤2 microorganisms: i) ≥106 CFB/L, ii) ≥107 CFB/L, and iii) ≥108 CFB/L. Negative urine cultures were samples with apparent contamination and sterile cultures or mixed flora (without quantification). Mixed flora was defined as growth of >2 microorganisms (without any further identification or quantification). Boxplots indicate the median and first and third quartiles, whiskers indicate the 2.5 and 97.5 percentiles. Bacterial count (BACT), the leucocyte count (WBC) from UF-5000.
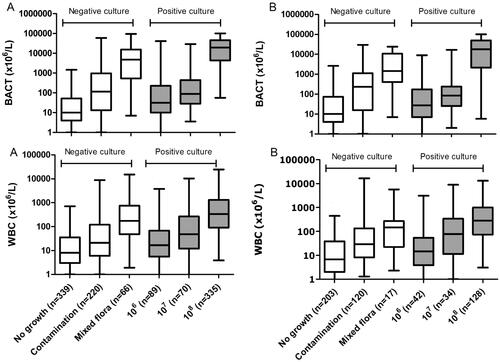
Figure 3. Receiver operating characteristic (ROC) curves, comparing UF-5000 results with bacterial culture classification. ROC curves were used to compare the cutoff points of bacterial count (BACT), leucocyte count (WBC), and yeast like cells (YLC) and the combined BACT*WBC and BACT*YLC count. The area under the curve (AUC) with 95% confidence intervals (CI) is shown for each parameter at all three culture levels. Positive urine cultures were grown with ≤2 microorganisms: i) ≥106 CFB/L, ii) ≥107 CFB/L, and iii) ≥108 CFB/L. Negative urine cultures were samples with apparent contamination and sterile cultures or mixed flora (without quantification). Mixed flora was defined as growth of >2 microorganisms (without any further identification or quantification). All samples were included (All Patient group, n = 1119).
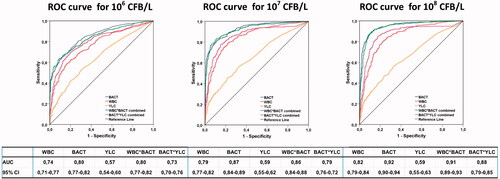
Table 2. Diagnostic performance of UF-5000 and dipsticks in comparison to urine culture.