Figures & data
Figure 1. Typical chromatogram for a patient sample at a fairly low level of 35 nmol/L 5-HIAA.
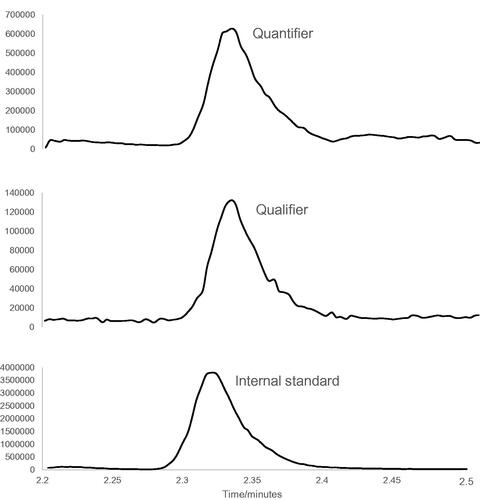
Figure 2. Difference plot (our lab – Huslab) for the comparison with Huslab, Helsinki, Finland. Included are the calculated bias and 95% confidence interval (Altman-Bland comparison).
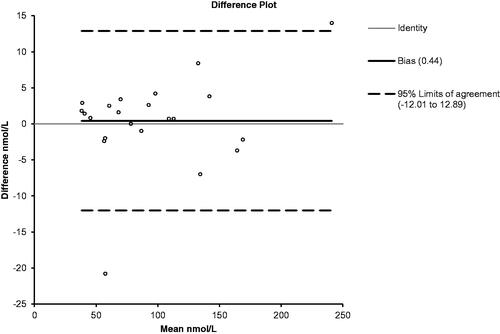
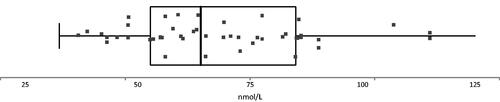
Figure 3. Box-plot of reference interval data from 39 of 40 blood donors. One outlier was found at 270 nmol/L. Median was 65 nmol/L. First and third quartile were at 55 and 84 nmol/L.