
Figures & data
Table 1. The CKD-EPI formula for calculating eGFR.
Table 2. Baseline clinical features of patients with or without DGF.
Table 3. The levels of Cys C and sCr in patients with or without DGF.
Figure 1. The longitudinal changes of cystatin C (Cys C) (left panel) and serum creatinine (sCr) (right panel) in delayed graft function (DGF) and prompt graft function (non-DGF) patients. The Cys C and sCr levels of DGF patients were higher than those of the non-DGF group at all time points. The sCr concentrations in both groups declined rapidly after surgery, the decrease in Cys C levels in the DGF group was slower than that in patients without DGF.
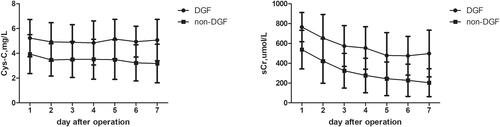
Figure 2. ROC analysis of sCr (A) and Cys C (B) for predicting DGF. Both Cys C and sCr predicted DGF, Cys C showed the largest area under curve.
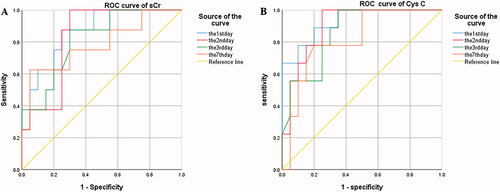
Table 4. The predictive value of Cys C and sCr by the ROC curves.
Table 5. SPS in RT recipients with or without DGF.
Table 6. The levels of Cys C and sCr in RT recipients with or without SPS.
Table 7. Follow-up of RT recipients with or without SPS.