Figures & data
Table 1. Pre- and intraoperative characteristics of the study population.
Table 2. Postoperative characteristics of the study population presented by the group.
Table 3. Concentration of suPAR at each specific time point presented for all patients (A), by each patient group (B and C), presentation of p values for comparisons of suPAR levels between the CABG and complex group at each timepoint (D) and the p value for differences between suPAR levels at aesthesia induction versus each timepoint for all patients (E), CABG patients (F) and the complex group (G).
Figure 1. Concentration of suPAR at each time point in the two patient groups (CABG surgery and complex procedures).
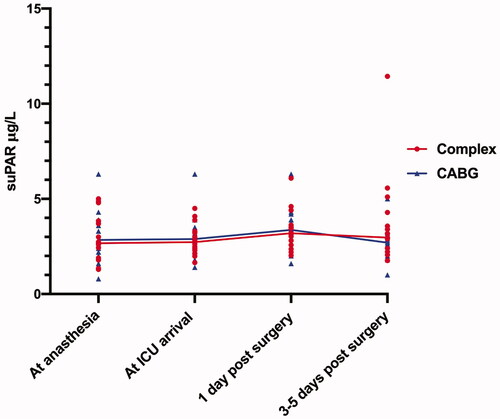
Figure 2. Correlation between suPAR levels on postoperative day 1 (left) and days 3–5 (right) and time on CPB.
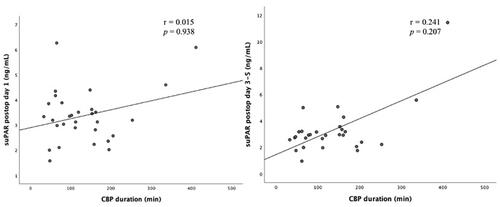
Figure 3. Correlation between suPAR levels on the first postoperative day and the levels of C-reactive protein (A), IL-6 (B), Heparin binding protein (C), and Myeloperoxidase levels (D) on the first postoperative day.
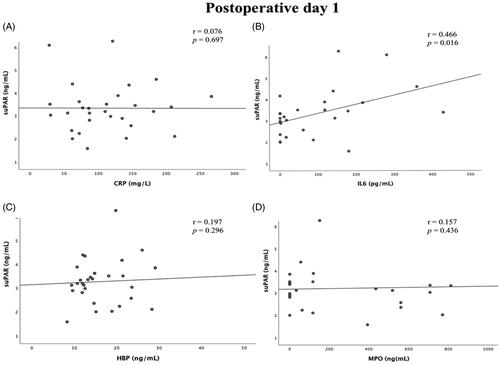
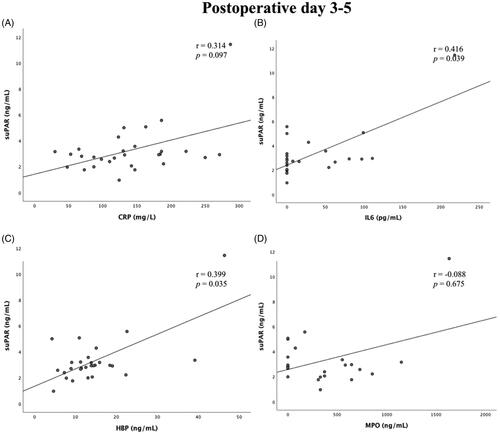
Figure 4. Correlation between suPAR levels on the first postoperative day and the levels of C-reactive protein (A), IL-6 (B), Heparin binding protein (C), and Myeloperoxidase levels (D) on the 3rd to 5th postoperative day.