
Figures & data
Figure 1. Histograms of the PIIINP measurements. Bin size 2. (A) Non-transformed frequencies. Vertical full lines indicate the calculated reference interval (4.42–16.0 µg/L), the vertical dotted lines indicated the 95% C.I. (B) Box-Cox transformed frequencies.
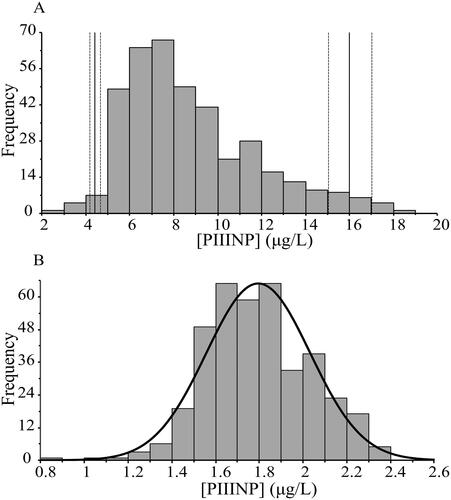
Figure 2. Procollagen III, N-terminal Propeptide (PIIINP) serum levels in different age groups. Box plots showing the median, the 25th and 75th quartiles, and the 2.5% and 97.5% quantiles values.
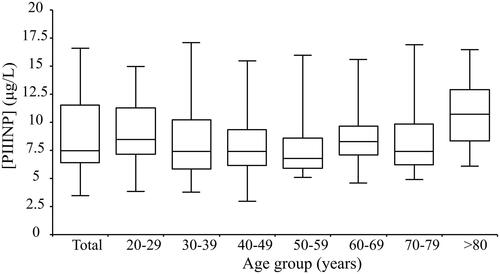
Table 1. PIIINP concentration by age group and sex.